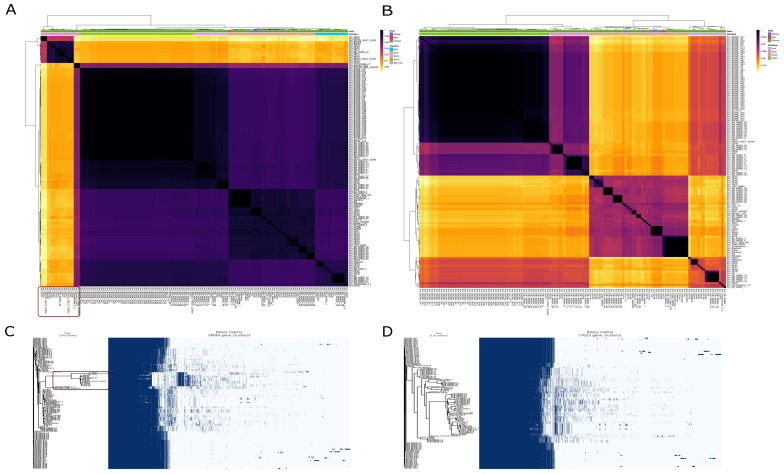
Figure 1.
Average nucleotide identity and gene presence-absence profile of initial dataset (149 strains) and final dataset (130 strains). The strains that are too diverse to be incorporated in the final dataset are encircled in both ANI heat map and gene presence-absence profile. (A) Average nucleotide identity of 149 strains. A dark red rectangle encircles excluding 19 strains. (B) Average nucleotide identity of the final dataset (130) strains. (C) Gene presence-absence profile of 149 strains. The dark red rectangle encircles the gene presence-absence profile of the strains to be excluded. The high proportion of genes in these strains is different from the rest of the strains. (D) The gene presence-absence profile of 130 strains that were used for downstream analysis after exclusion of confounding strains.

