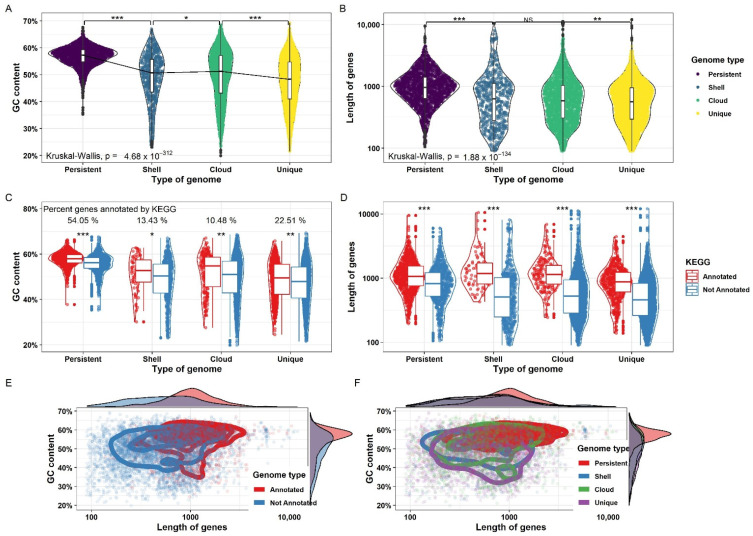
Figure 8.
Distribution of GC content and gene length among different sections of the pan-genome. (A) Distribution of GC content in the persistent, cloud, shell, and unique genome. The difference in the GC content among different sections was found to be significant with a very low p-value. (B) Distribution of gene length across different sub-sections of the pan-genome. The difference is non-significant between the cloud and shell genomes while significant for others. (C) GC content across different sub-sections of the pan-genome is further divided into genes that are annotated by KAAS and those that are not annotated by KAAS within each sub-section. The difference in GC content between annotated and non-annotated genes was found to be significant within each group. (D) Gene length across different sub-sections of the pan-genome is further divided into genes that are annotated by KAAS and those that are not annotated by KAAS within each sub-section. The difference in gene length between annotated and non-annotated genes was found to be significant within each group. (E,F) GC content and gene length was plotted for annotated and non-annotated genes and across all sub-sections of the pan-genome. It was observed that annotated genes tend to have higher GC content and gene length. Similarly, GC content and gene length tended to be for the persistent genome as compared to the cloud, shell, and unique genomes. Significance is denoted by: “***” if p value is less than 0.001, “**” if p value is less than 0.01 and more than 0.001 and “*” if p value is less than 0.05 and more than 0.01.

