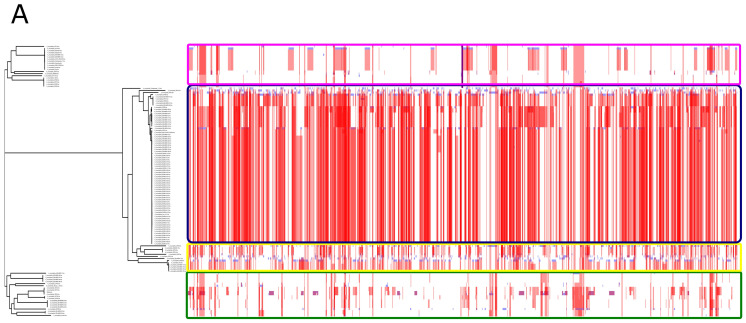
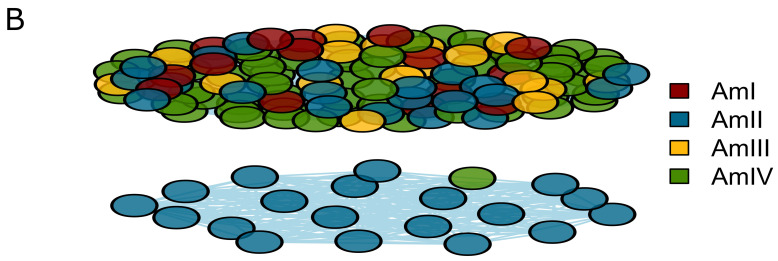
Figure 9.
Evolutionary dynamics of A. muciniphila depicting recombination. (A) Recombination among different strains as depicted by Gubbins. Based on the recombination pattern, it is evident that all phylogroups share recombination as indicated by the red tiles. (B) Network graph of the recombination pattern showed two distinct clusters. One cluster contains strains from all the phylogroups while one cluster consists of some strains of AmII and one strain of AmIV.


