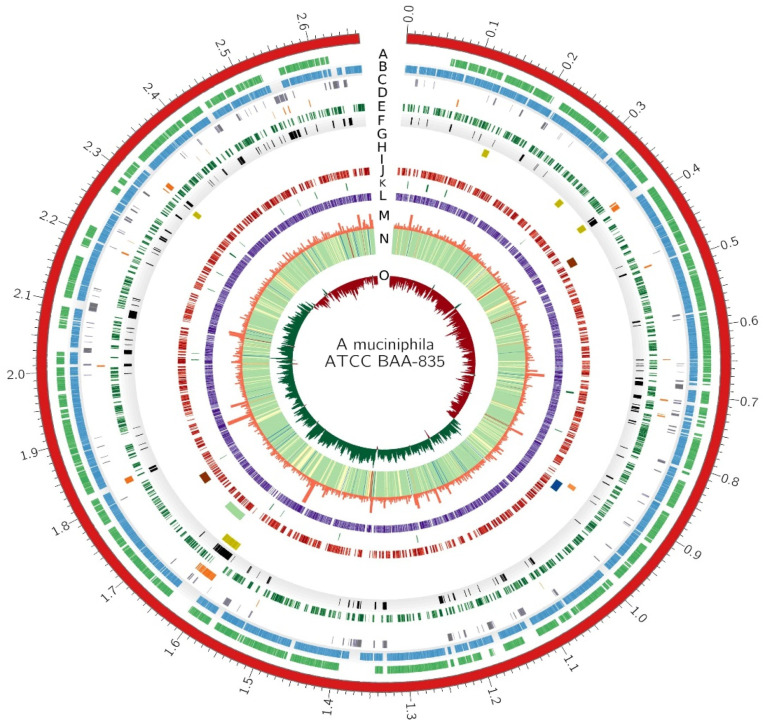
Figure 11.
Circos plot of A. muciniphila ATCC BAA 835. Different layers of the circos are represented by A–O. A—genes that are present in 100% of the genomes, B—genes that are present in 95% of the genomes, C—shell genome, D—unique genome, E—essential genes, F—undesired genes (those that are neither essential nor persistent, G—genomic islands, H—phages as depicted by PHASTER, I—secondary metabolite gene clusters by AntiSMASH, J—genes annotated by KEGG, K—genes annotated by GO, L—genes annotated by COG, M—histogram of gene length, N—heatmap of GC content, O—histogram of GC-skew.

