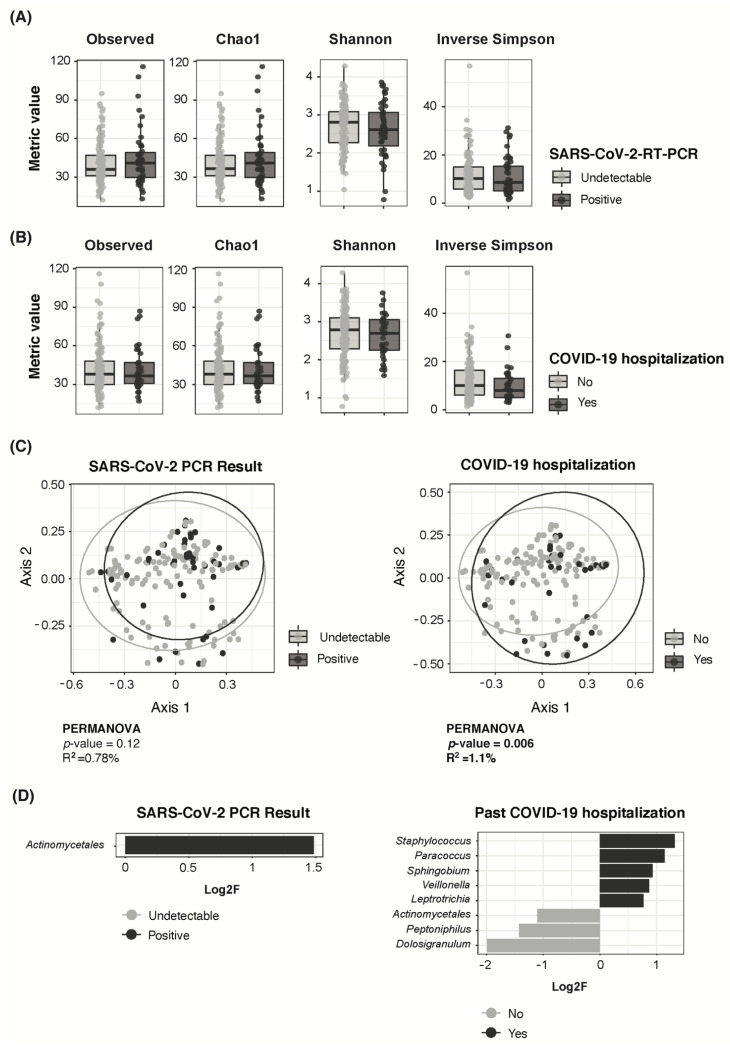
Figure 4.
Nasopharyngeal microbiota composition in adults according to SARS-CoV-2 RNA persistence and COVID-19 severity. (A) Boxplots showing richness (Observed and Chao 1) and diversity (Shannon and Inverse Simpson) metrics between SARS-CoV-2 RNA persistence groups in adults. (B) Boxplots showing richness (Observed and Chao 1) and diversity (Shannon and Inverse Simpson) metrics by history of COVID-19-related hospitalization in adults. (C) PCoA ordination analysis on Bray–Curtis ecological distance matrix showing distribution of SARS-CoV-2 positive and negative adult samples on the left, and by history of COVID-19 hospitalization on the right. (D) Differential abundance analysis on bacterial genera by SARS-CoV-2 RNA persistence (left) or by history of COVID-19-related hospitalization (right). Log2F is shown along the X-axis and differential genera are colored based on the group they relate to.

