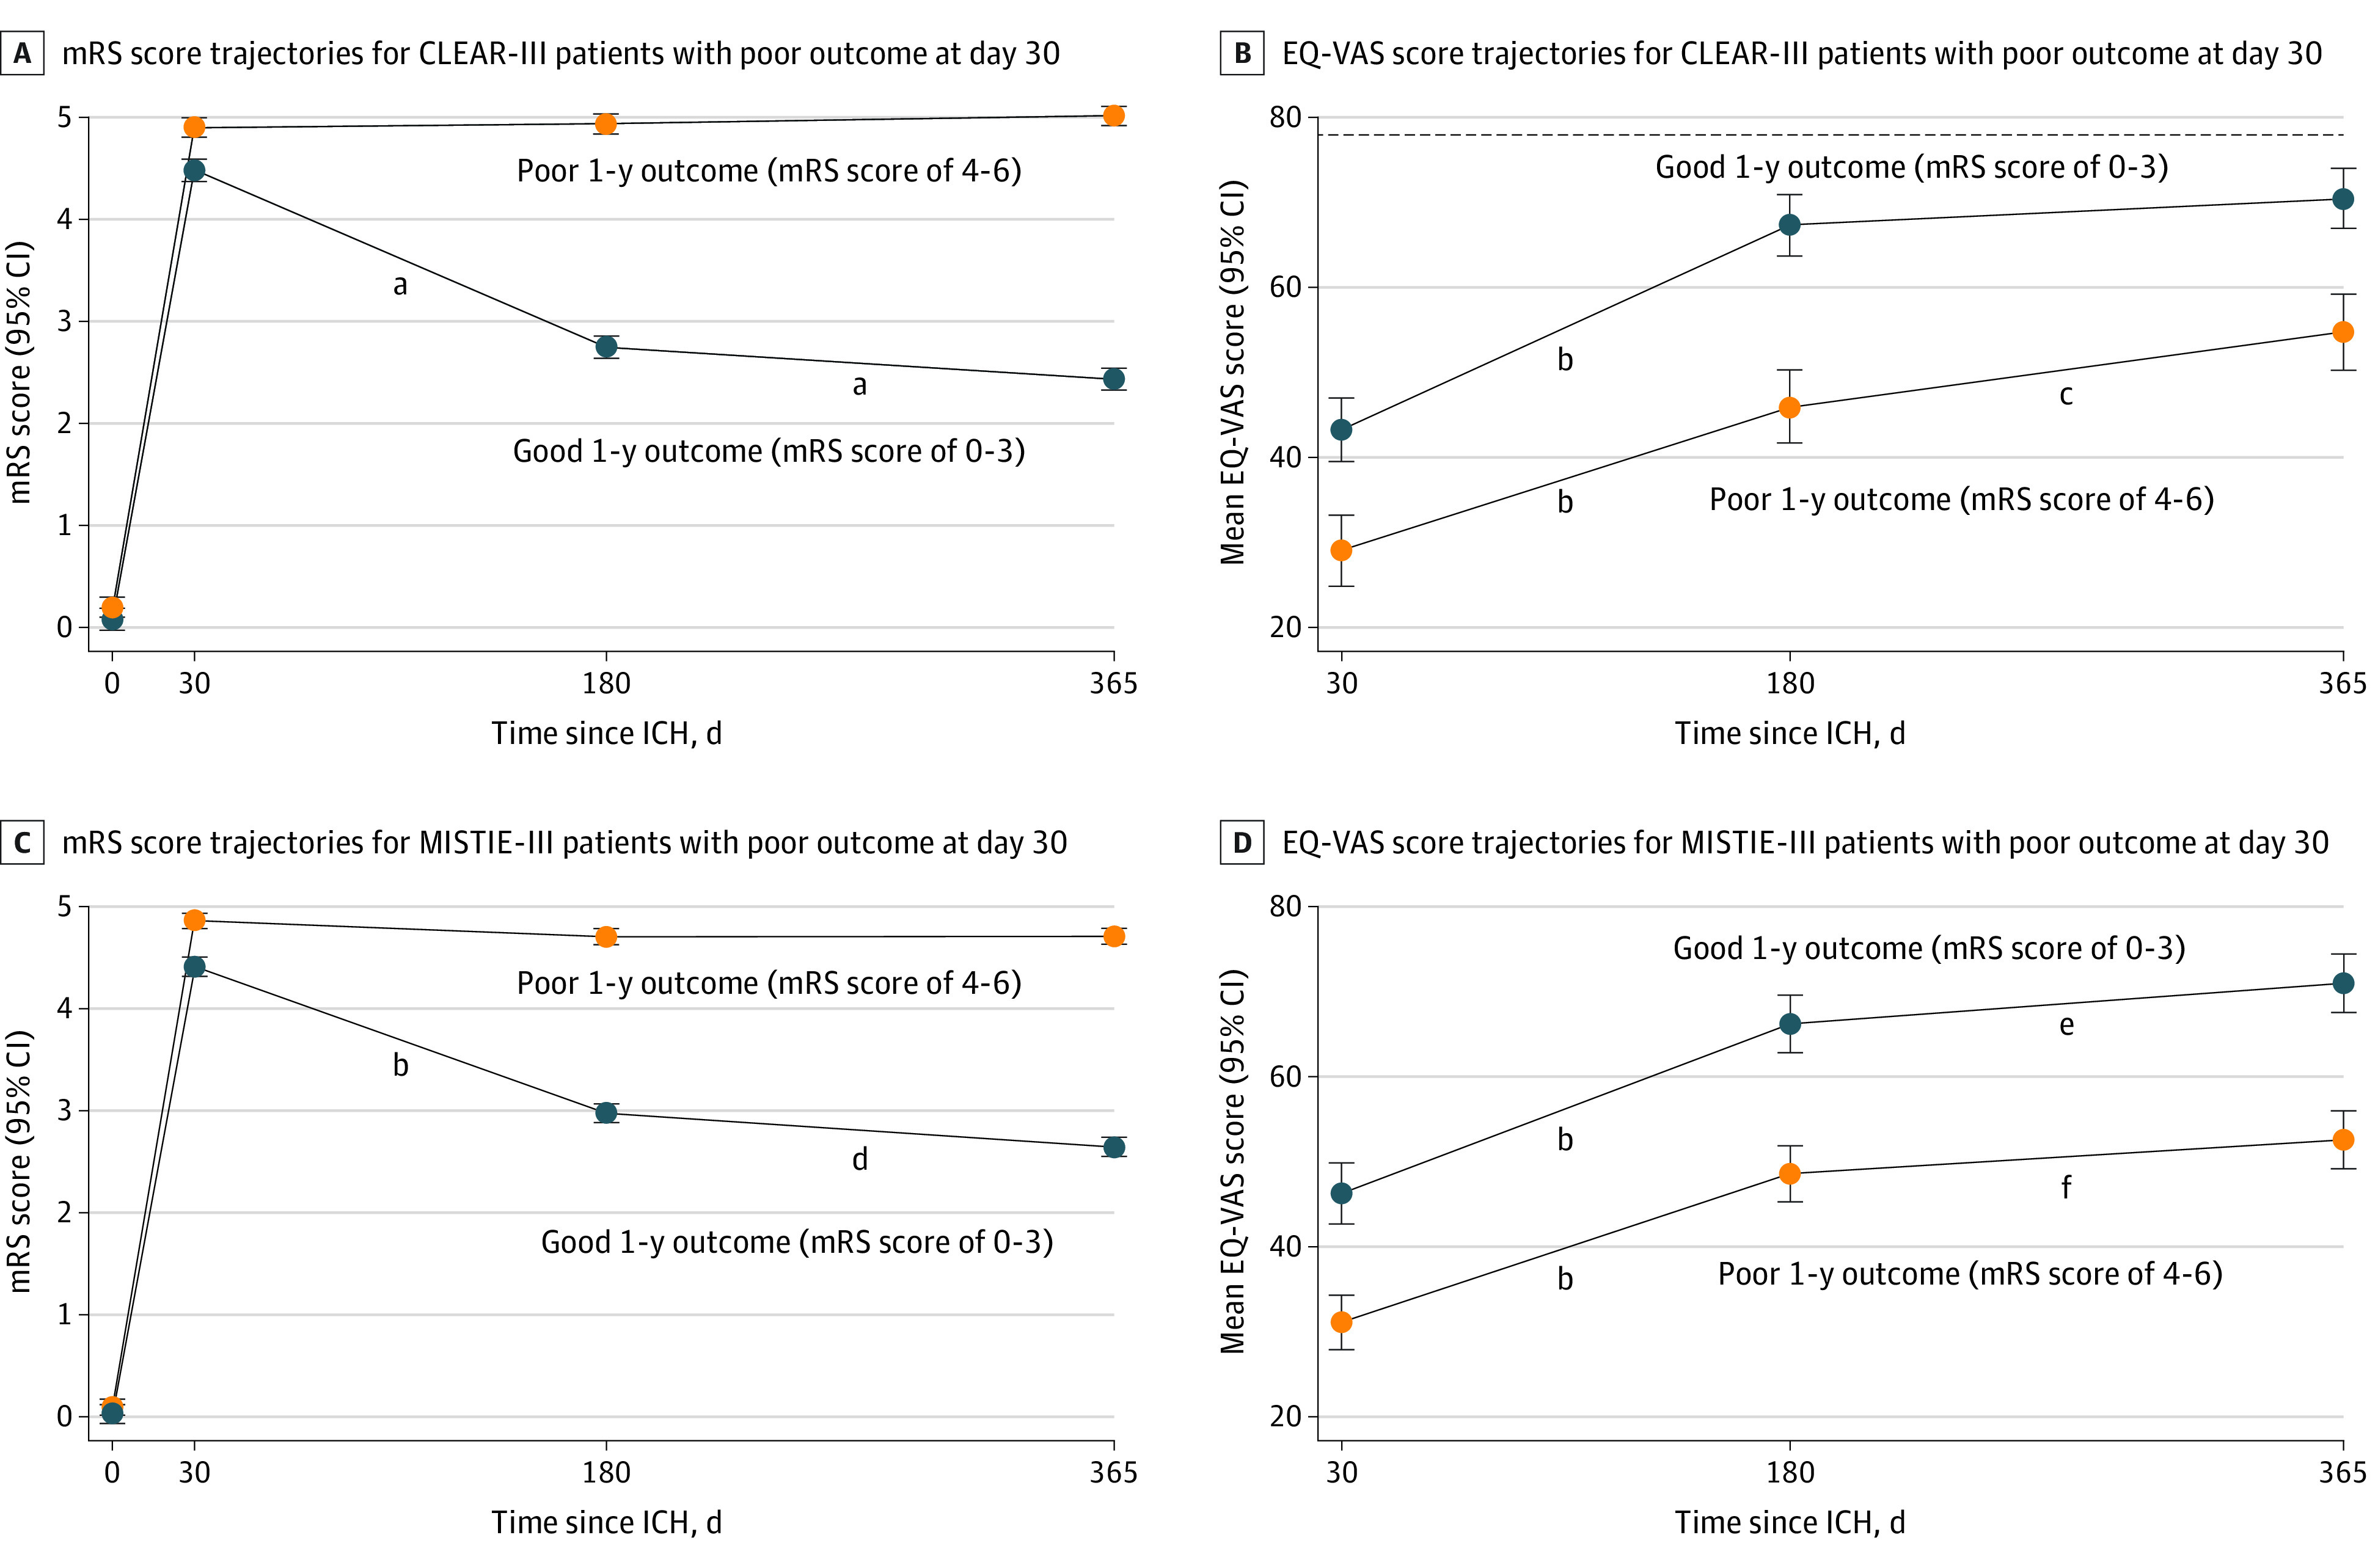
Figure 3. Linear Prediction of Modified Rankin Scale Score (mRS) and European Quality of Life Scale (EuroQol) Visual Analog Scale (EQ-VAS) Score Trajectories for Patients With Poor Outcomes at Day 30 in the CLEAR-III and MISTIE-III cohorts.

A and B, Adjusted linear predictions of trajectories of mean mRS (n = 339) and mean EQ-VAS (n = 297) scores for patients with good vs poor outcomes at 1 year in CLEAR-III. C and D, Adjusted linear predictions of trajectories of mean mRS (n = 376) and mean EQ-VAS score (n = 358) for patients with good vs poor outcomes at 1 year in MISTIE-III. B and D, Dotted line indicates mean age-matched US population norm for EQ-VAS score. CLEAR-III indicates Clot Lysis: Evaluating Accelerated Resolution of Intraventricular Hemorrhage Phase 3 Trial; ICH, intracerebral hemorrhage; IVH, intraventricular hemorrhage; MISTIE-III, Minimally Invasive Surgery Plus Alteplase for Intracerebral Hemorrhage Evacuation Phase 3 Trial.
aP < .001.
bDay 30 vs day 180, P < .001.
cDay 180 vs day 365, P = .002.
dDay 180 vs day 365, P < .001.
eDay 180 vs day 365, P = .02.
fDay 180 vs day 365, P = .05.
