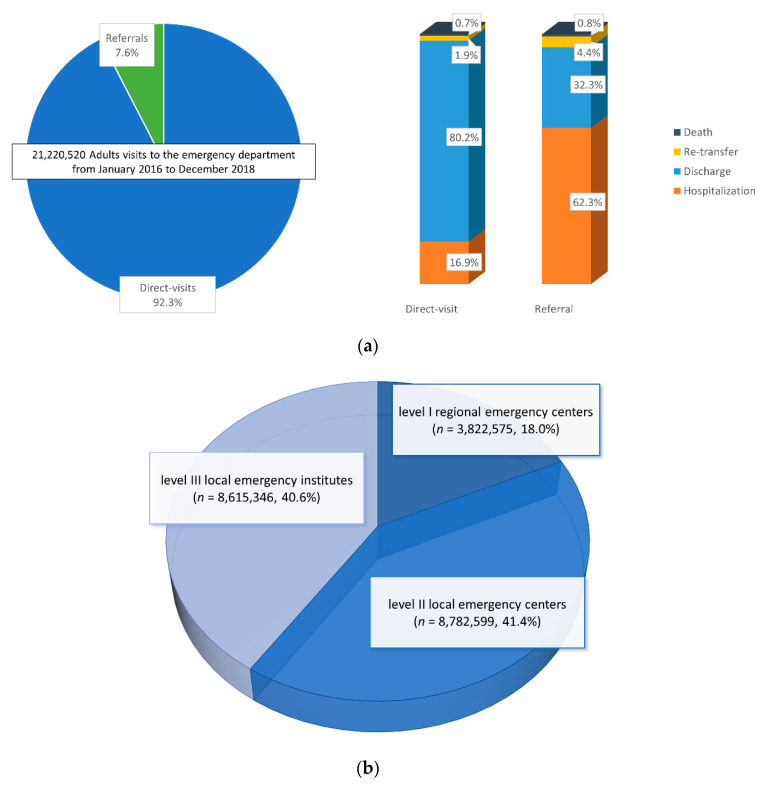
Figure 1.
(a) Composition of adult emergency department (ED) visits from 2016 to 2018 by the route of visit. The ED dispositions are presented in the right 100% stacked-bar graph, comparing the direct-visit group with the referral group. (b) The proportion of ED visits by the level of ED is presented.

