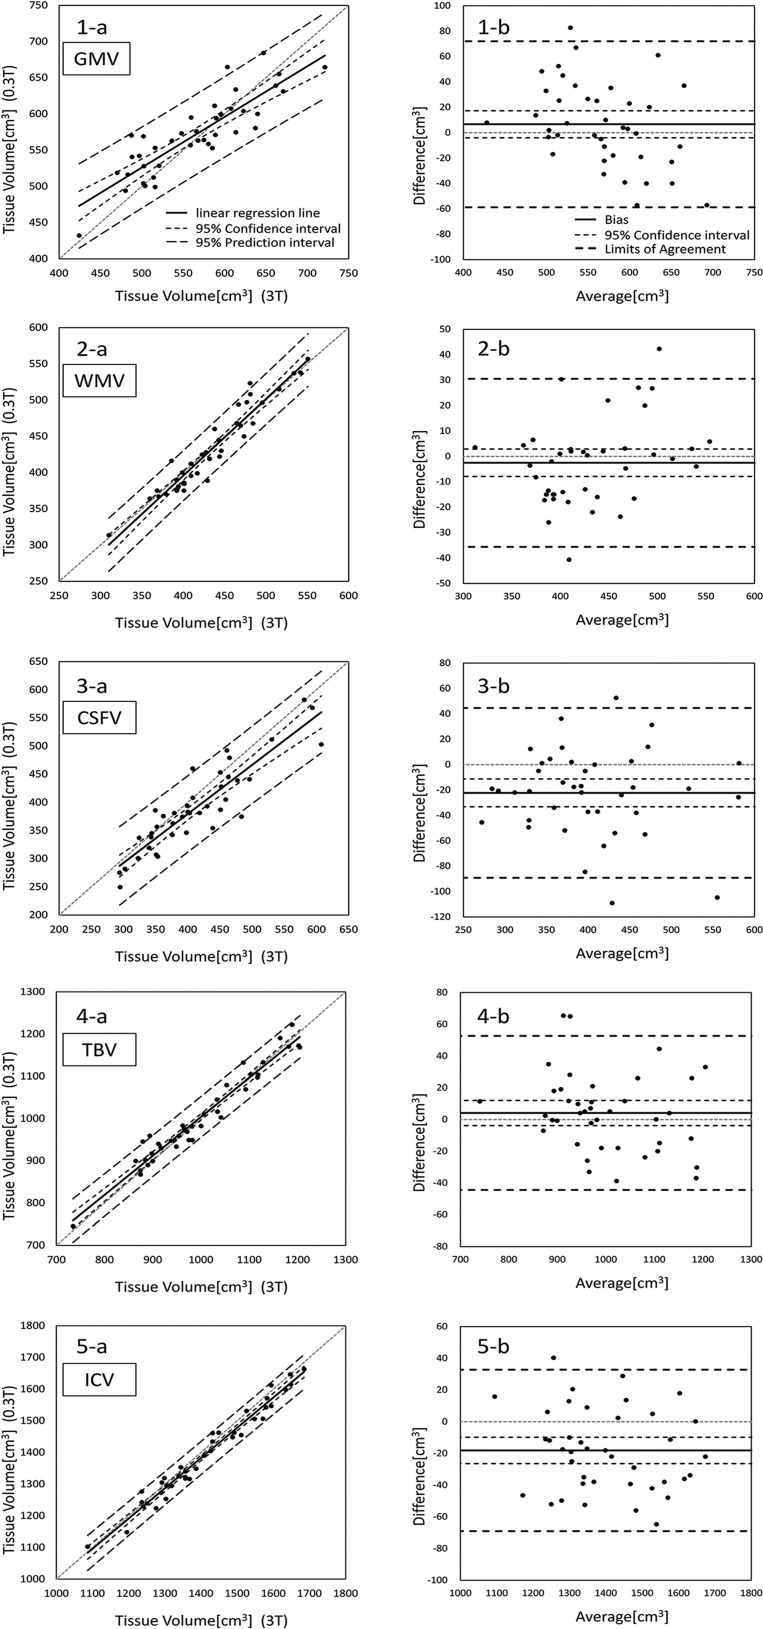
Fig. 2.
The left row (a) shows the scatter plots with lines of equality, and the right row (b) shows the Bland-Altman graph (difference was calculated as the volume obtained from the 0.3-T scanner minus the volume obtained from the 3-T scanner) of each volume (1, GMV; 2, WMV; 3, CSFV; 4, TBV; 5, ICV) compared between 0.3- and 3-T scanners. CSFV, cerebrospinal fluid volume; GMV, gray matter volume; ICV, intracranial volume; TBV, total brain volume; WMV, white matter volume.

