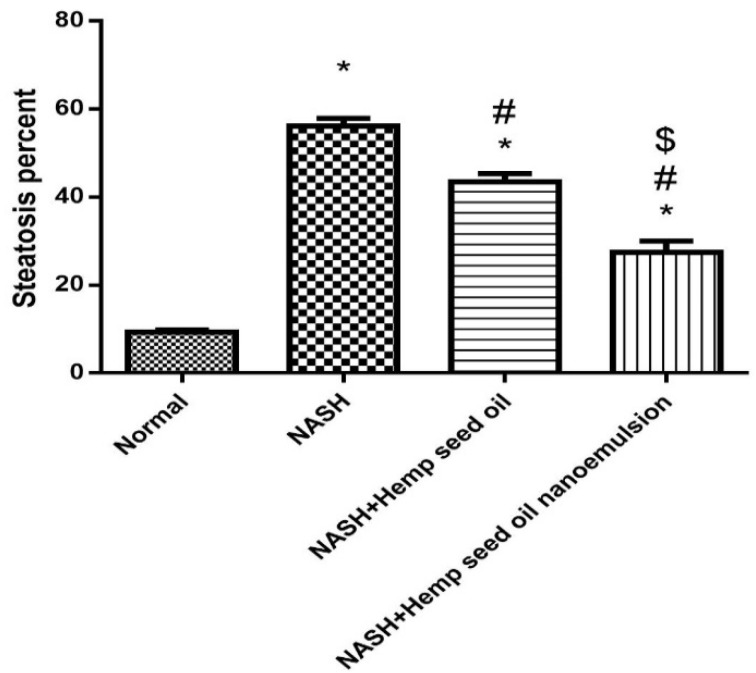
Figure 6.
Steatosis score in the hepatic tissues stained with hematoxylin and eosin. Steatosis areas were measured in each microscopic image by labeling the fatty spaces by ImageJ software in images captured at ×400 magnification. Data were processed for statistical analysis using the one-way ANOVA and then Bonferroni’s test for pair-wise comparison at p < 0.05. Data are expressed as means ± SD. * Different from normal group, # Different from the NASH group. $ Different from NASH+ hemp seed oil group at p < 0.05.

