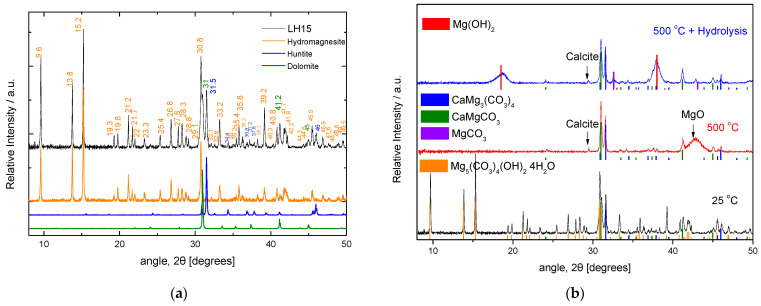
Figure 5.
(a) The LH15 X-Ray diffractogram (on top) along with three colored diffractograms at the bottom, which correspond to the XRD mineralogical library data for hydromagnesite, huntite, and dolomite. (b) XRD diffractograms of the LH15 precursor material (at the bottom) and the material obtained after thermal treatment at 500 °C (in the middle) and after thermal treatment and subsequent hydrolysis (on the top). Colored lines indicate the position of the peaks for the corresponding crystal structures denoted on the left-hand side of the plot.

