
Figure 3.
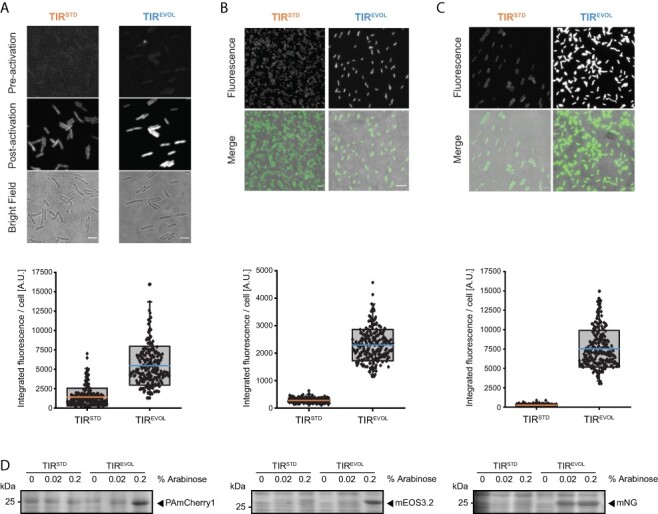
Output from araC pBAD and TIREVOL is increased across multiple coding sequences. Expression of (A) PAmCherry1, (B) mEos3.2 and (C) mNeonGreen from pBAD/HisB-sfGFP (TIRSTD and TIREVOL). All plasmids were harbored in the MC1061 strain and induced with 0.2% (w/v) L-arabinose. Cells were visualized by fluorescence microscopy (top panels) (scale bars = 4 µm). Note that PAmCherry1 has to be activated for visualization and that mEos3.2 was imaged in its green state. Fluorescence intensity values from individual cells were quantified (bottom panels): PAmCherry1 (TIRSTD) = 1414 ± 1137 (mean ± S.D.) (n = 244), PAmCherry1 (TIREVOL) = 5457 ± 2516 (n = 219). mEos3.2 (TIRSTD) = 257 ± 81 (n = 217), mEos3.2 (TIREVOL) = 2291 ± 571 (n = 243). mNeonGreen (TIRSTD) = 227 ± 67 (n = 251), mNeonGreen (TIREVOL) = 7037 ± 1456 (n = 229). The edges of the box show S.D., colored mid line is mean and whiskers indicate the 1–99% interval. Note also that variability in the data was partly caused by the fact that measurements were made on cells that were at different stages of their cell cycle (which affects cell size and, therefore, total fluorescence) (D) Cells were induced with different concentrations of L-arabinose and then separated by SDS-PAGE and stained with Coomassie. Unprocessed gel images are available in the Online Supplement, Supplementary Figures S2 and S3.