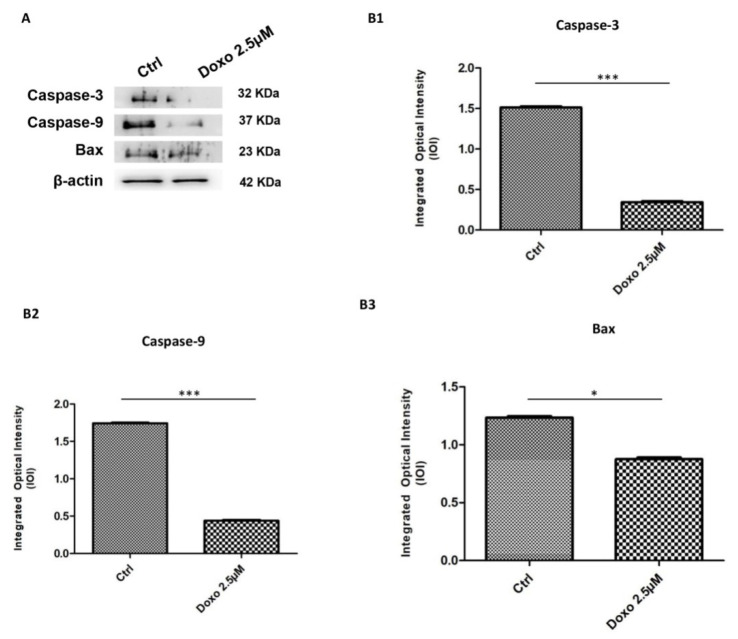
Figure 7.
Western blotting analysis of apoptosis related markers. (A) Caspase-3, caspase-9 and Bax proteins expression in Cal-27 cell line untreated and treated with 2.5 μM Doxo. Each membrane was probed with β-actin antibody to verify loading consistency. Western blot data shown are the representative data from three different experiments. (B1–B3) Histograms represent densitometric measurements of proteins bands expressed as integrated optical intensity (IOI) mean of three separate experiments. The error bars show standard deviation (± SD). Densitometric values analyzed by t-test (unpaired t-test) return significant differences. *** p < 0.001, * p < 0.05.

