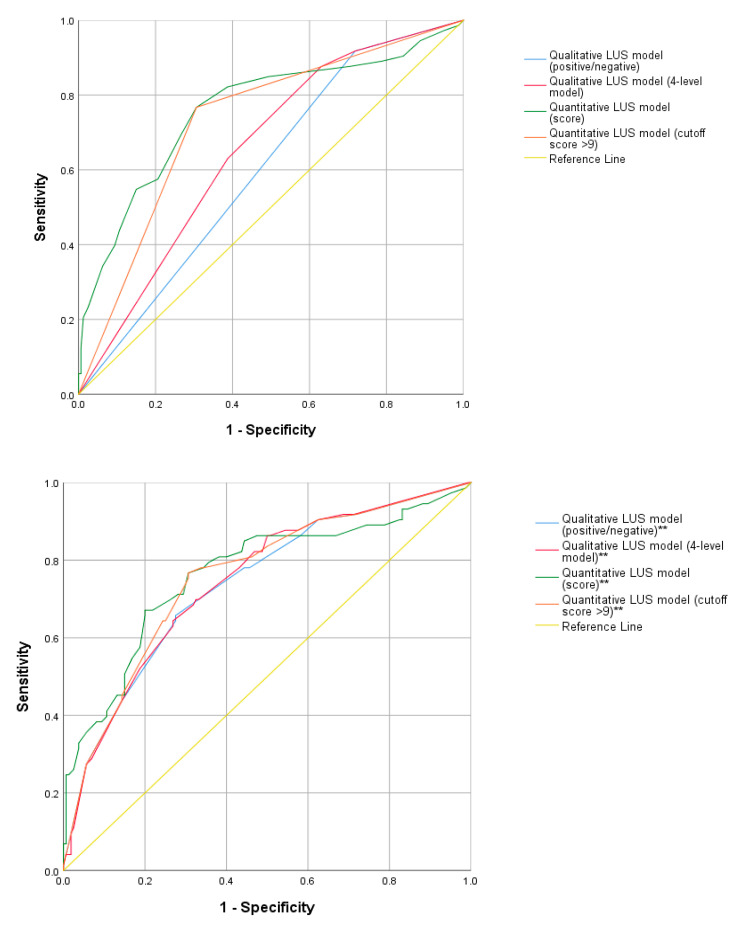
Figure 4.
ROC curves comparing qualitative (positive/negative LUS, 4-level LUS including normal, interstitial, consolidative and mixed pattern) and quantitative (mean scores, cutoff score of 9) LUS models. ** ROC curves using the LUS models with the adjunction of the LUS variables “extension” and “early involvement of paravertebral areas”.

