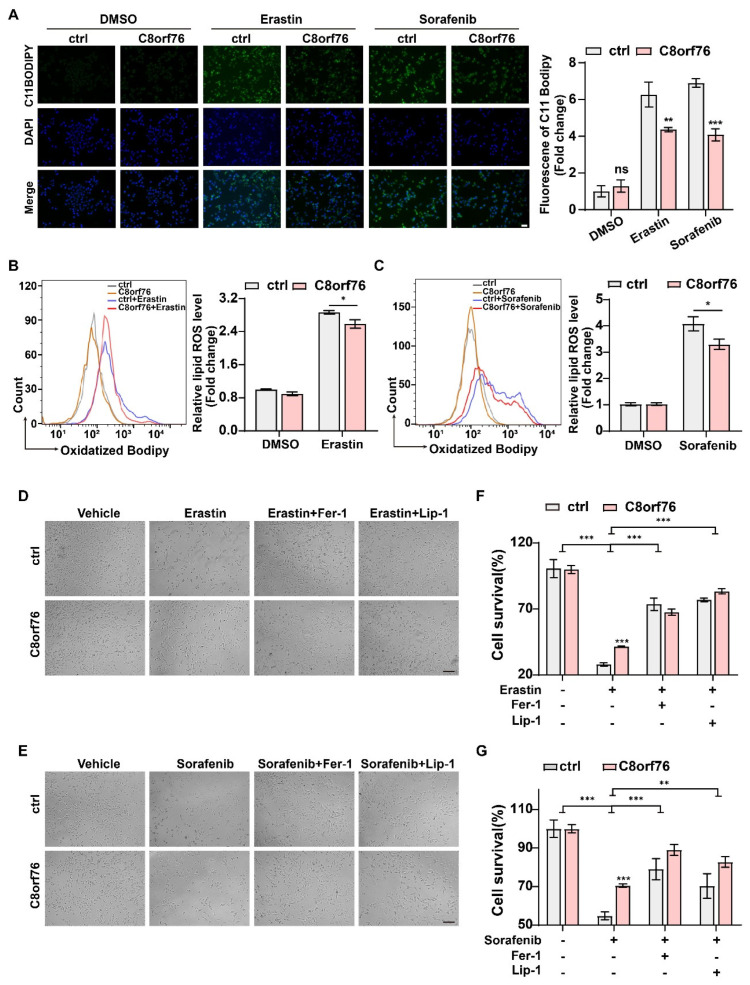
Figure 6.
Erastin and sorafenib-induced accumulation of lipid ROS and ferroptois in C8orf76OE cells. Lipid ROS production followed by erastin and sorafenib was viewed by an inverted fluorescent microscope (A) and detected by flow cytometry (B,C). Scale bars represent 50 μm. (D,E) HCC cells were visualized at the treatment of 7.5 μM erastin or 7.5 μM sorafenib with or without ferroptosis inhibitors (Fer−1, 1 μM; Lip−1, 0.4 μM). Scale bars represent 200 μm. (F,G) MTS assay was performed to monitor the cell viability induced by erastin (7.5 μM) or sorafenib (7.5 μM) combined with or without ferroptosis inhibitors (Fer−1, 1 μM; Lip−1, 0.4 μM). Data were presented as mean +SD. * p < 0.05; ** p < 0.01; *** p < 0.001; ns, not significant. Fer−1, ferrostatin−1; Lip−1, liproxstatin−1.

