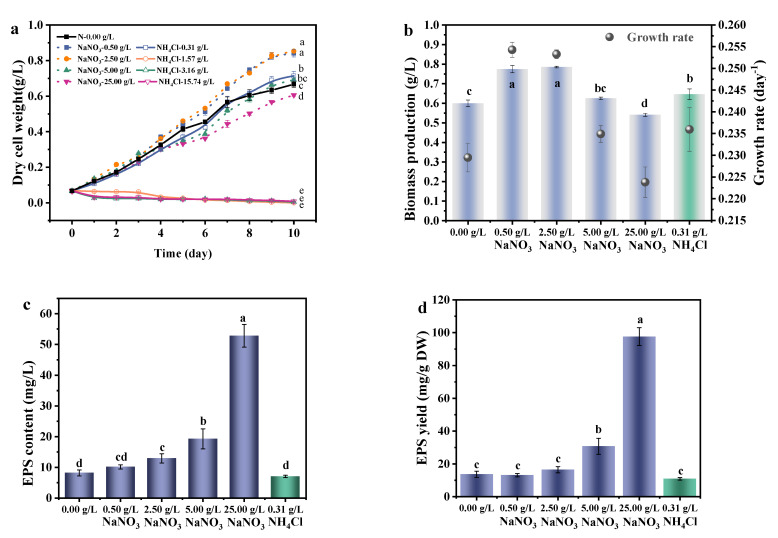
Figure 4.
The effects of nitrogen source and concentration on the growth and EPS secretion of A. platensis: (a) Growth curves; (b) Biomass production and growth rate; (c) EPS content; (d) EPS yield; DW: dry weight; a–e: Different letters above the bars indicated a significant difference among the groups. Points showed average of three independent measurements; vertical bars indicated the standard deviation. (p < 0.01, n = 3).

