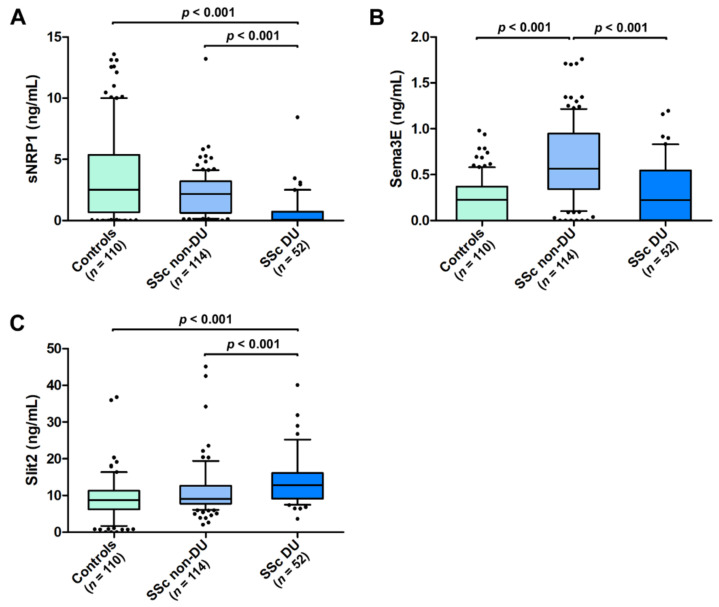
Figure 4.
Serum levels of (A) sNRP1, (B) Sema3E, and (C) Slit2 in healthy controls and SSc patients with and without ischemic DUs. The data are presented as box plots. Each box denotes the 25th to 75th percentiles. Lines outside the boxes are the 10th and 90th percentiles. Lines inside the boxes denote the median, while dots the outliers; p values are indicated. DUs, digital ulcers; Sema3E, semaphorin 3E; sNRP1, soluble neuropilin 1.

