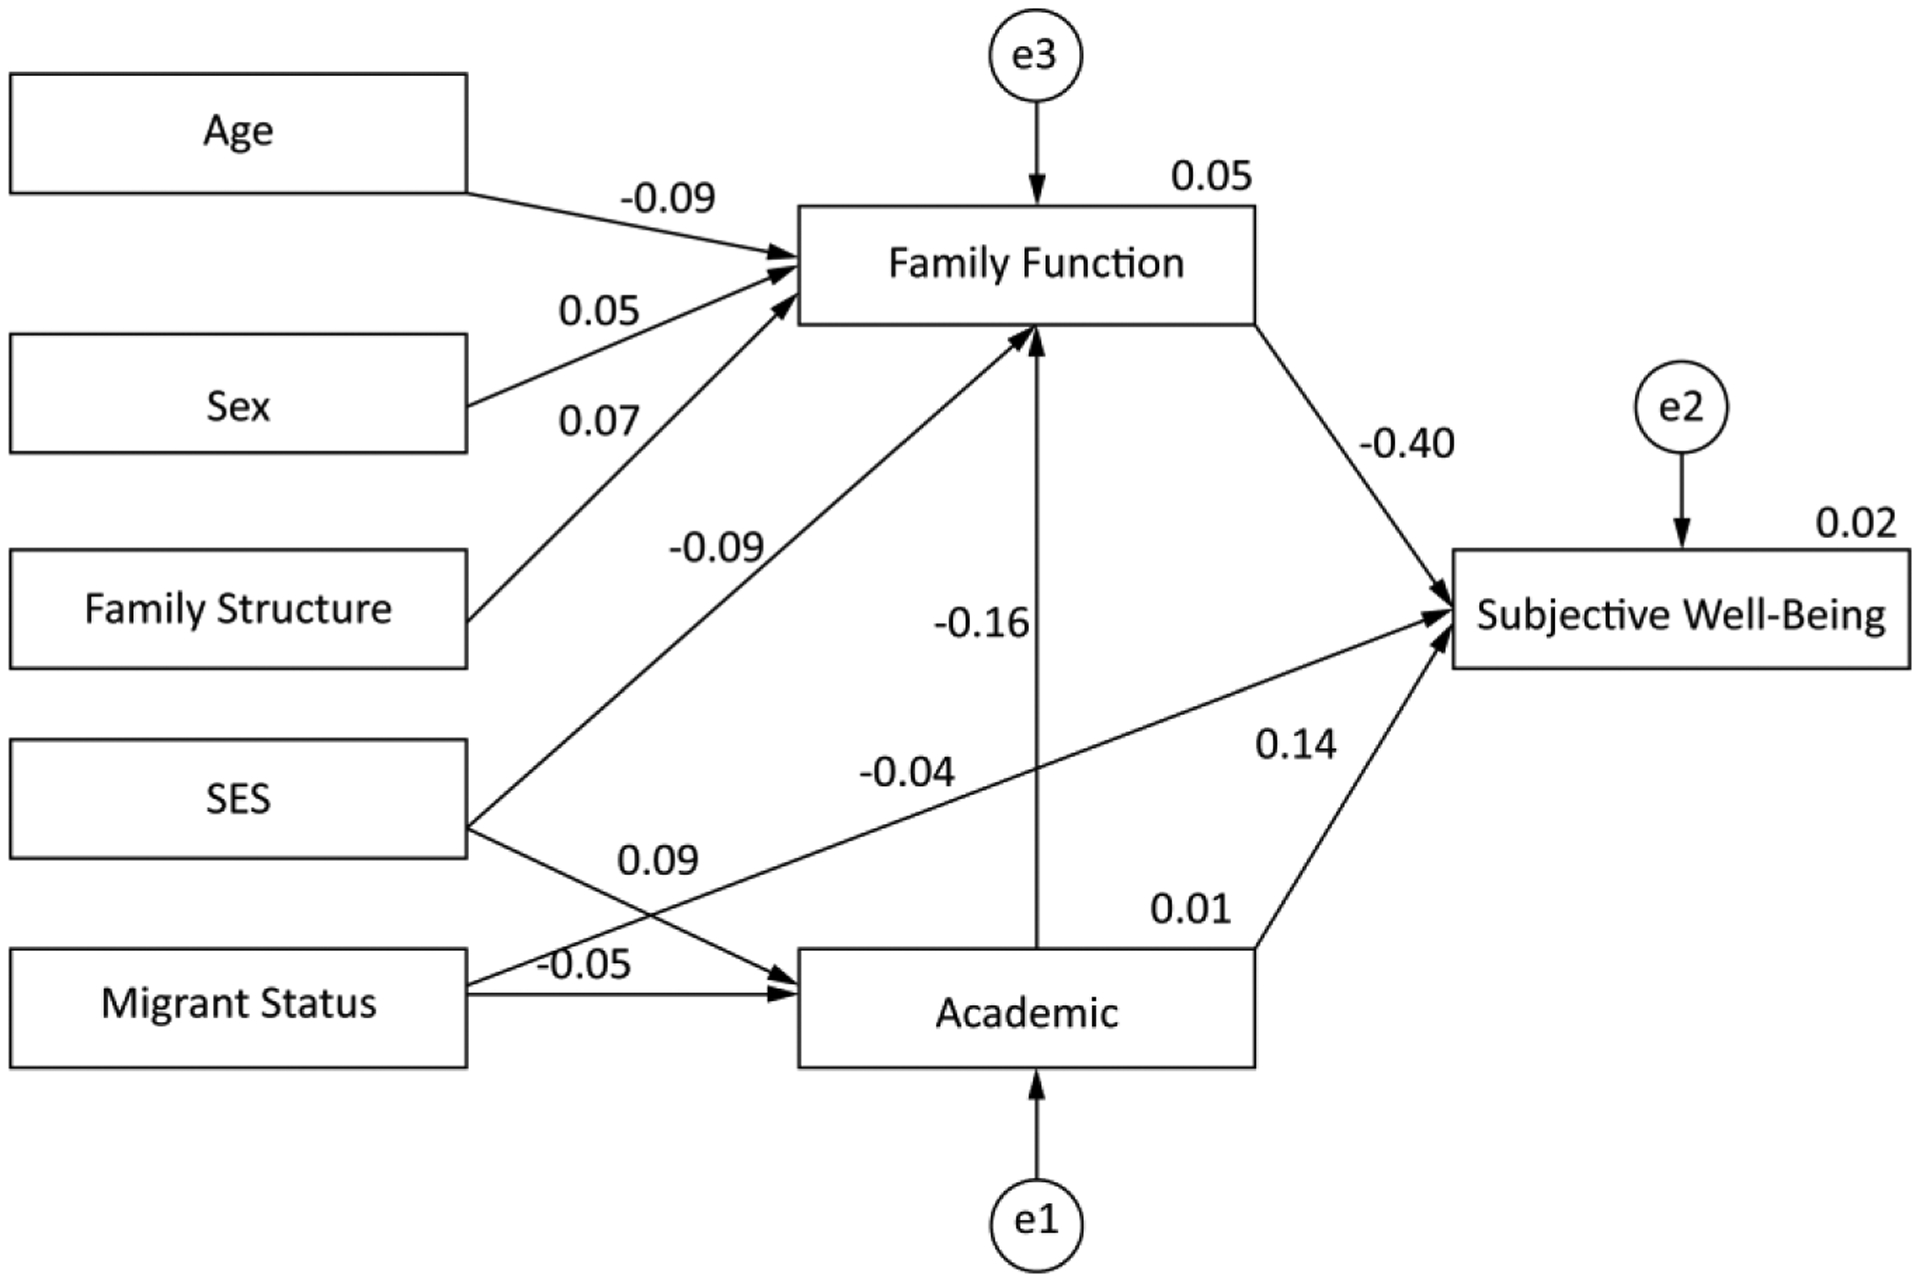
Figure 1.

Structural equation modeling among sex, academic performance, family function, family structure, SES, SWB, and migrant status. Family Structure: 1 = Extended family, 2 = Nuclear family, 3 = Restructured family, 4 = Single-parent family; SES: 1 = Low, 2 = Middle, 3 = High; Academic: 1 = Fail, 2 = Poor, 3 = Average, 4 = Good, 5 = Excellent; Migrant Status: 1 = NLB, 2 = LBF, 3 = LBM, 4 = LBB.
