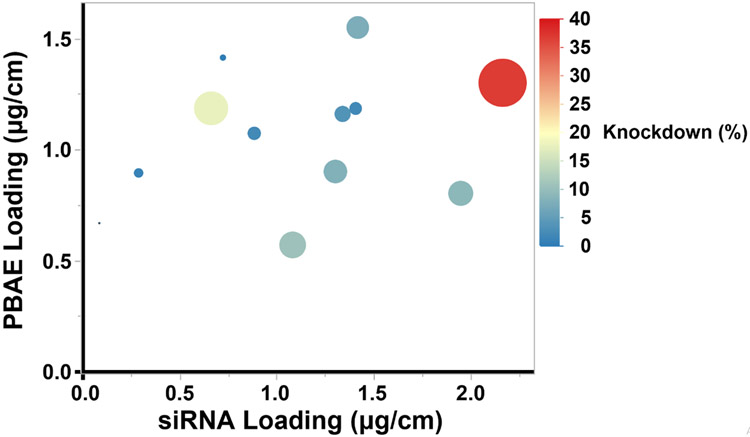
Figure 4.
Bubble plot of in vitro knockdown by PBAE loading and siRNA loading. Resulting GFP knockdown data of LbL films are represented with siRNA loading on the x-axis and PBAE loading on the y-axis. Knockdown of biological replicates was averaged. LbL coated sutures that effected greater knockdown are represented with larger bubbles. The knockdown is also color coded with high knockdown in red and low knockdown in blue.

