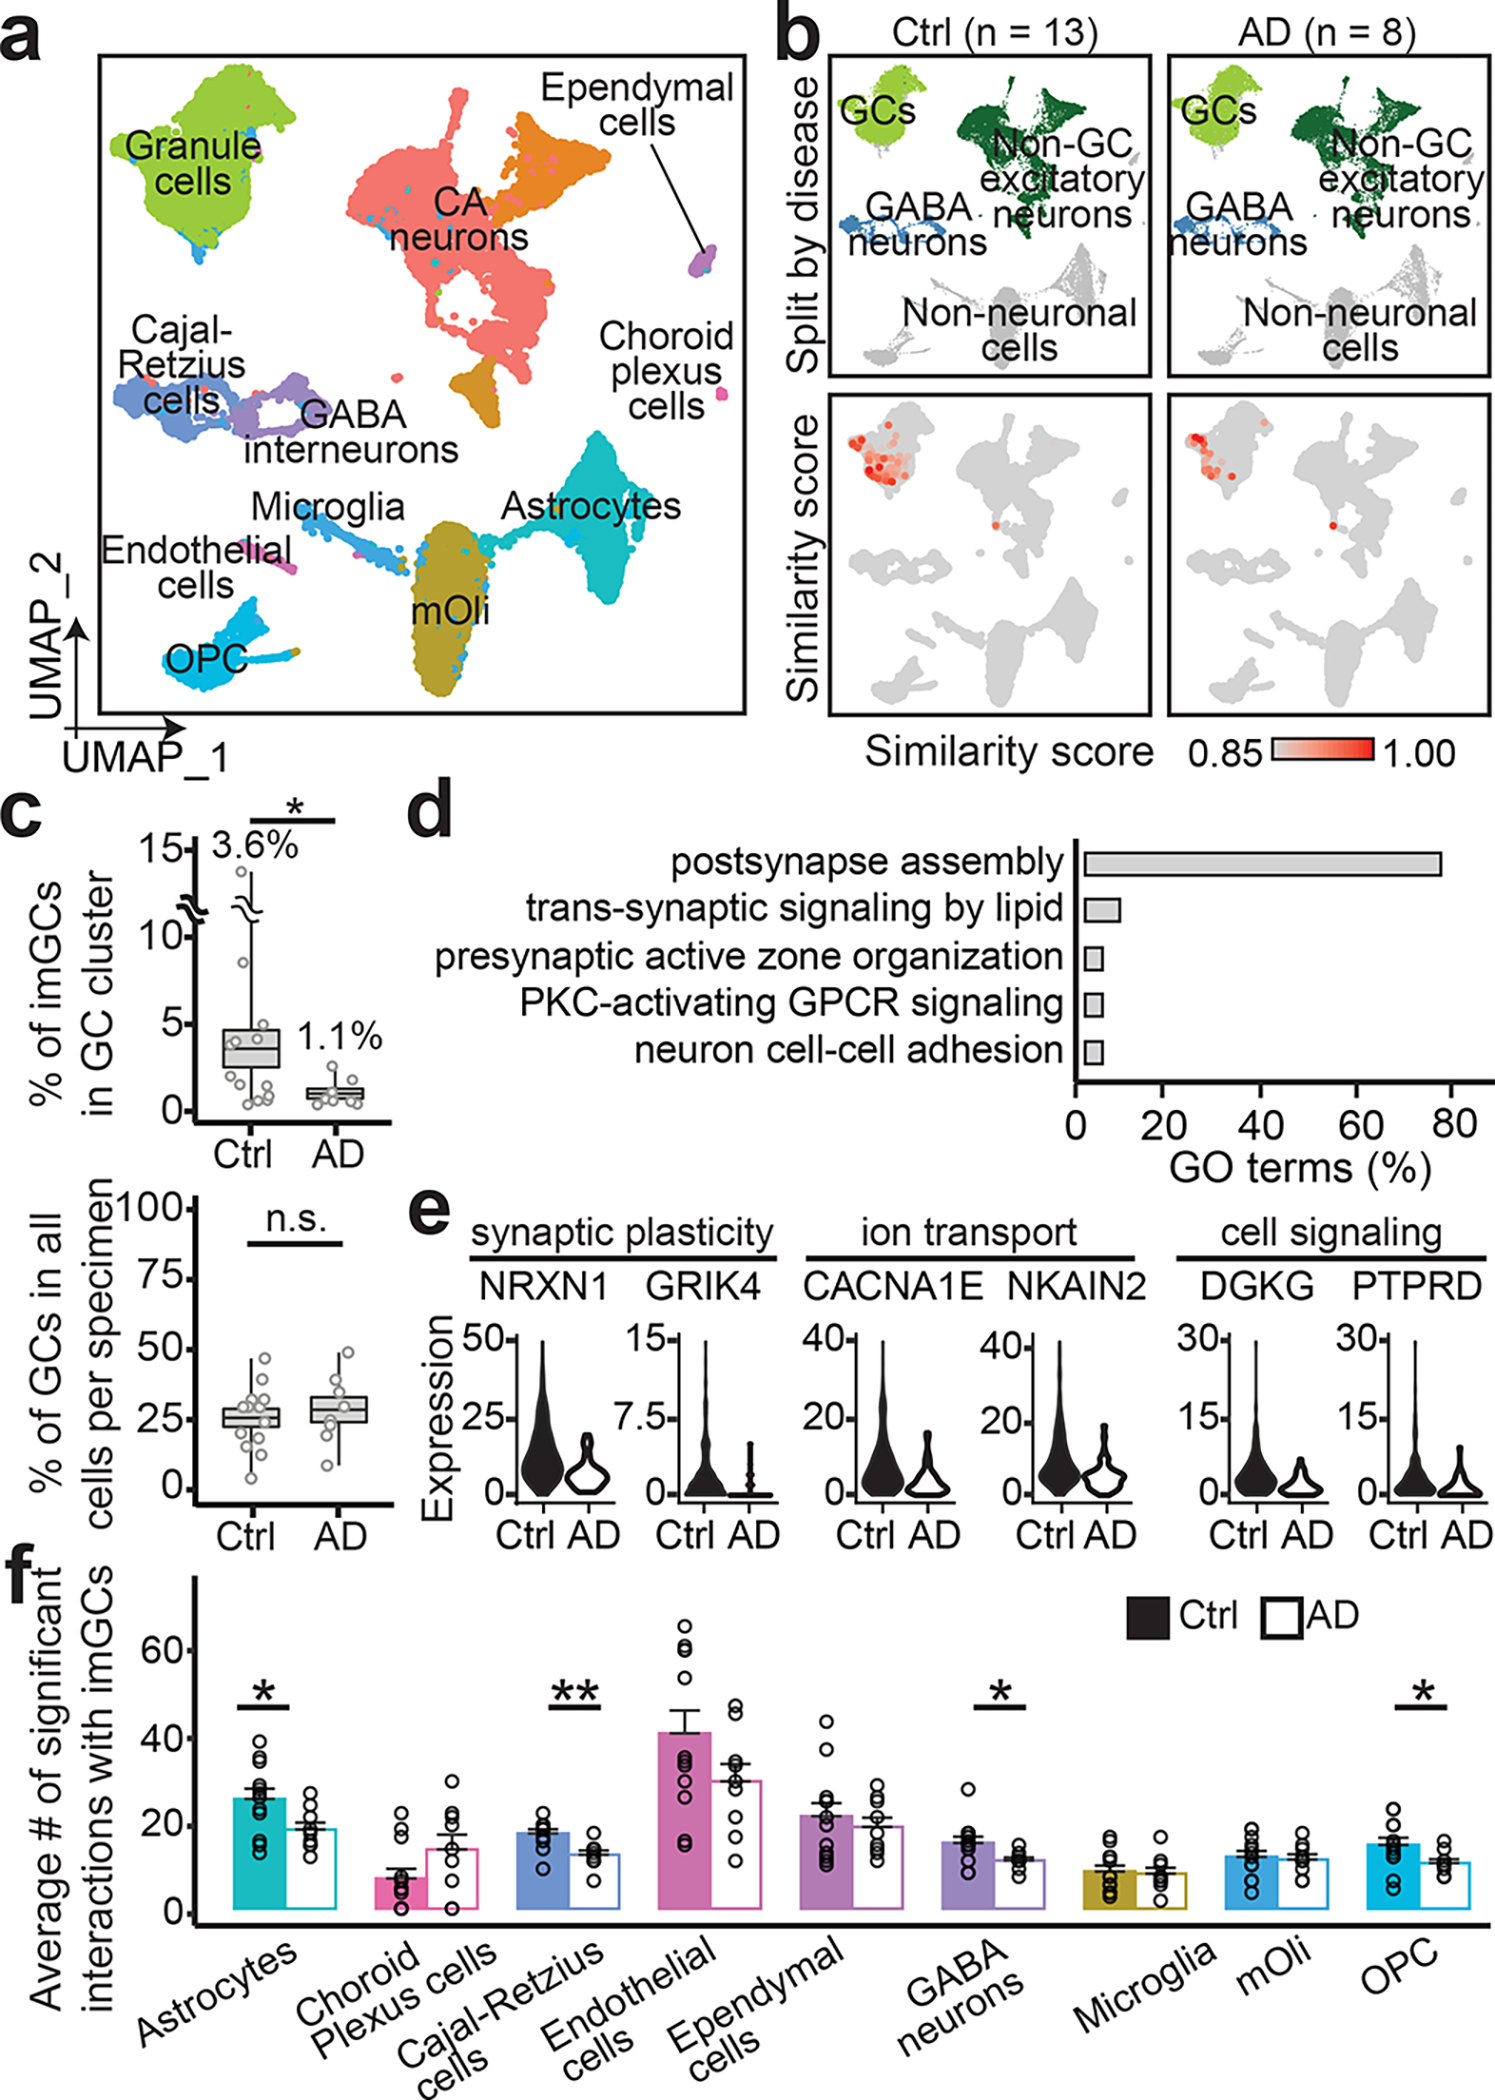
Fig. 4 |. Reduced number and altered gene expression of imGCs in AD patients.

a, b, UMAP plots of the integrated dataset of AD patients and controls (Ctrl) colored by cluster (a) and broad cell class (top row) and similarity score to prototypical imGCs (bottom row) (b). c, Quantifications of proportions of imGCs among GCs (top) and GCs among total cells obtained per specimen (bottom). Each dot represents data from one specimen and boxes represent mean ± s.e.m. with whiskers for max and min (n = 8 and 13 subjects for AD and control, respectively; *: p = 0.0197; n.s., not significant; one-tailed Mann-Whitney test). d, e, GO terms (d) and examples (e) of genes downregulated in imGCs in AD. f, Quantifications of numbers of significant ligand-receptor pairs of imGCs interacting with neighboring cell types (using CellPhoneDB42). Each dot represents data from one specimen. Values represent mean + s.e.m. (n = 8 and 13 subjects from AD and controls, respectively; *p < 0.05; **p < 0.005; p-value of significant pairs from left to right: 0.013, 0.001, 0.017, and 0.012; one-tailed Mann-Whitney test).
