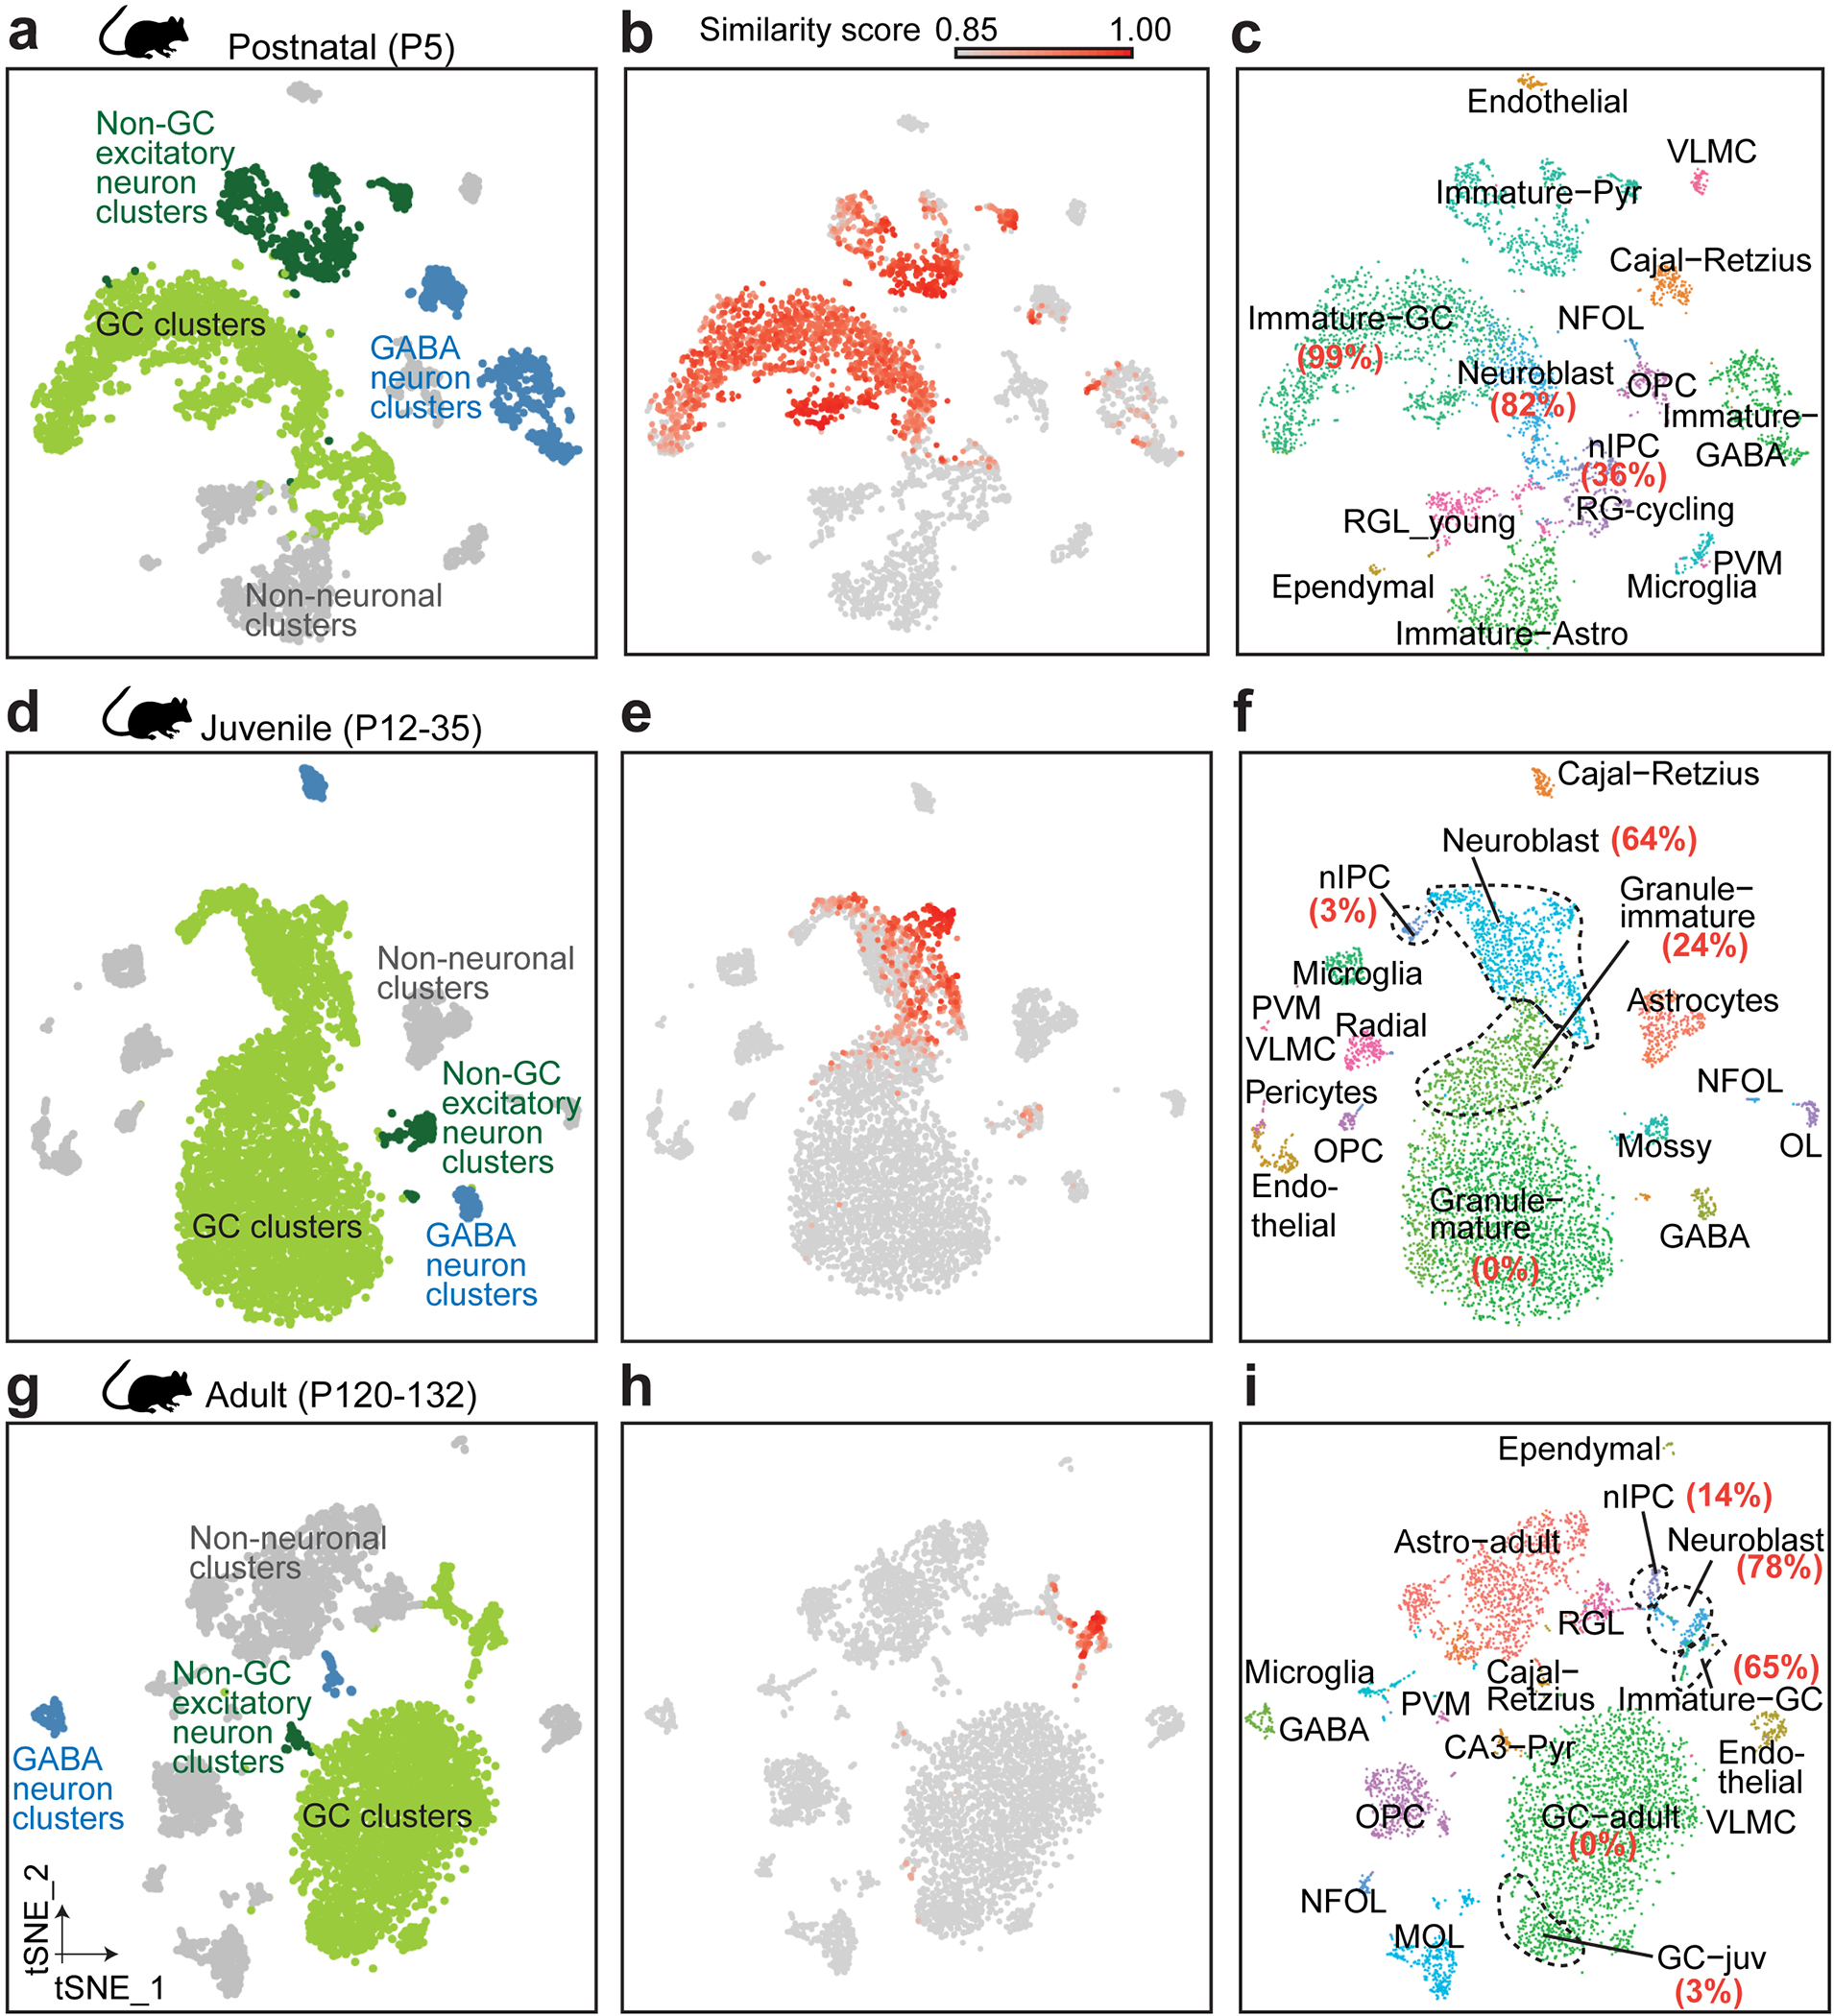
Extended Data Fig. 3 |. Validation of prototype-based scoring of mouse imGCs across ages by the trained machine learning model with published annotations based on unsupervised clustering.

a, b, d, e, g, h, t-SNE visualization of previously published mouse hippocampal datasets9 at postnatal (a), juvenile (d), and adult (g) stages, colored by four broad cell classes and by similarity score to prototypical imGCs (b, e, h). c, f, i, Benchmarking cells with high similarity scores (p ≥ 0.85) with the published annotations9. Percentage of cells in the GC lineage clusters (based on published annotations9) that are selected as imGCs by our trained machine learning model are indicated in red, bold text.
