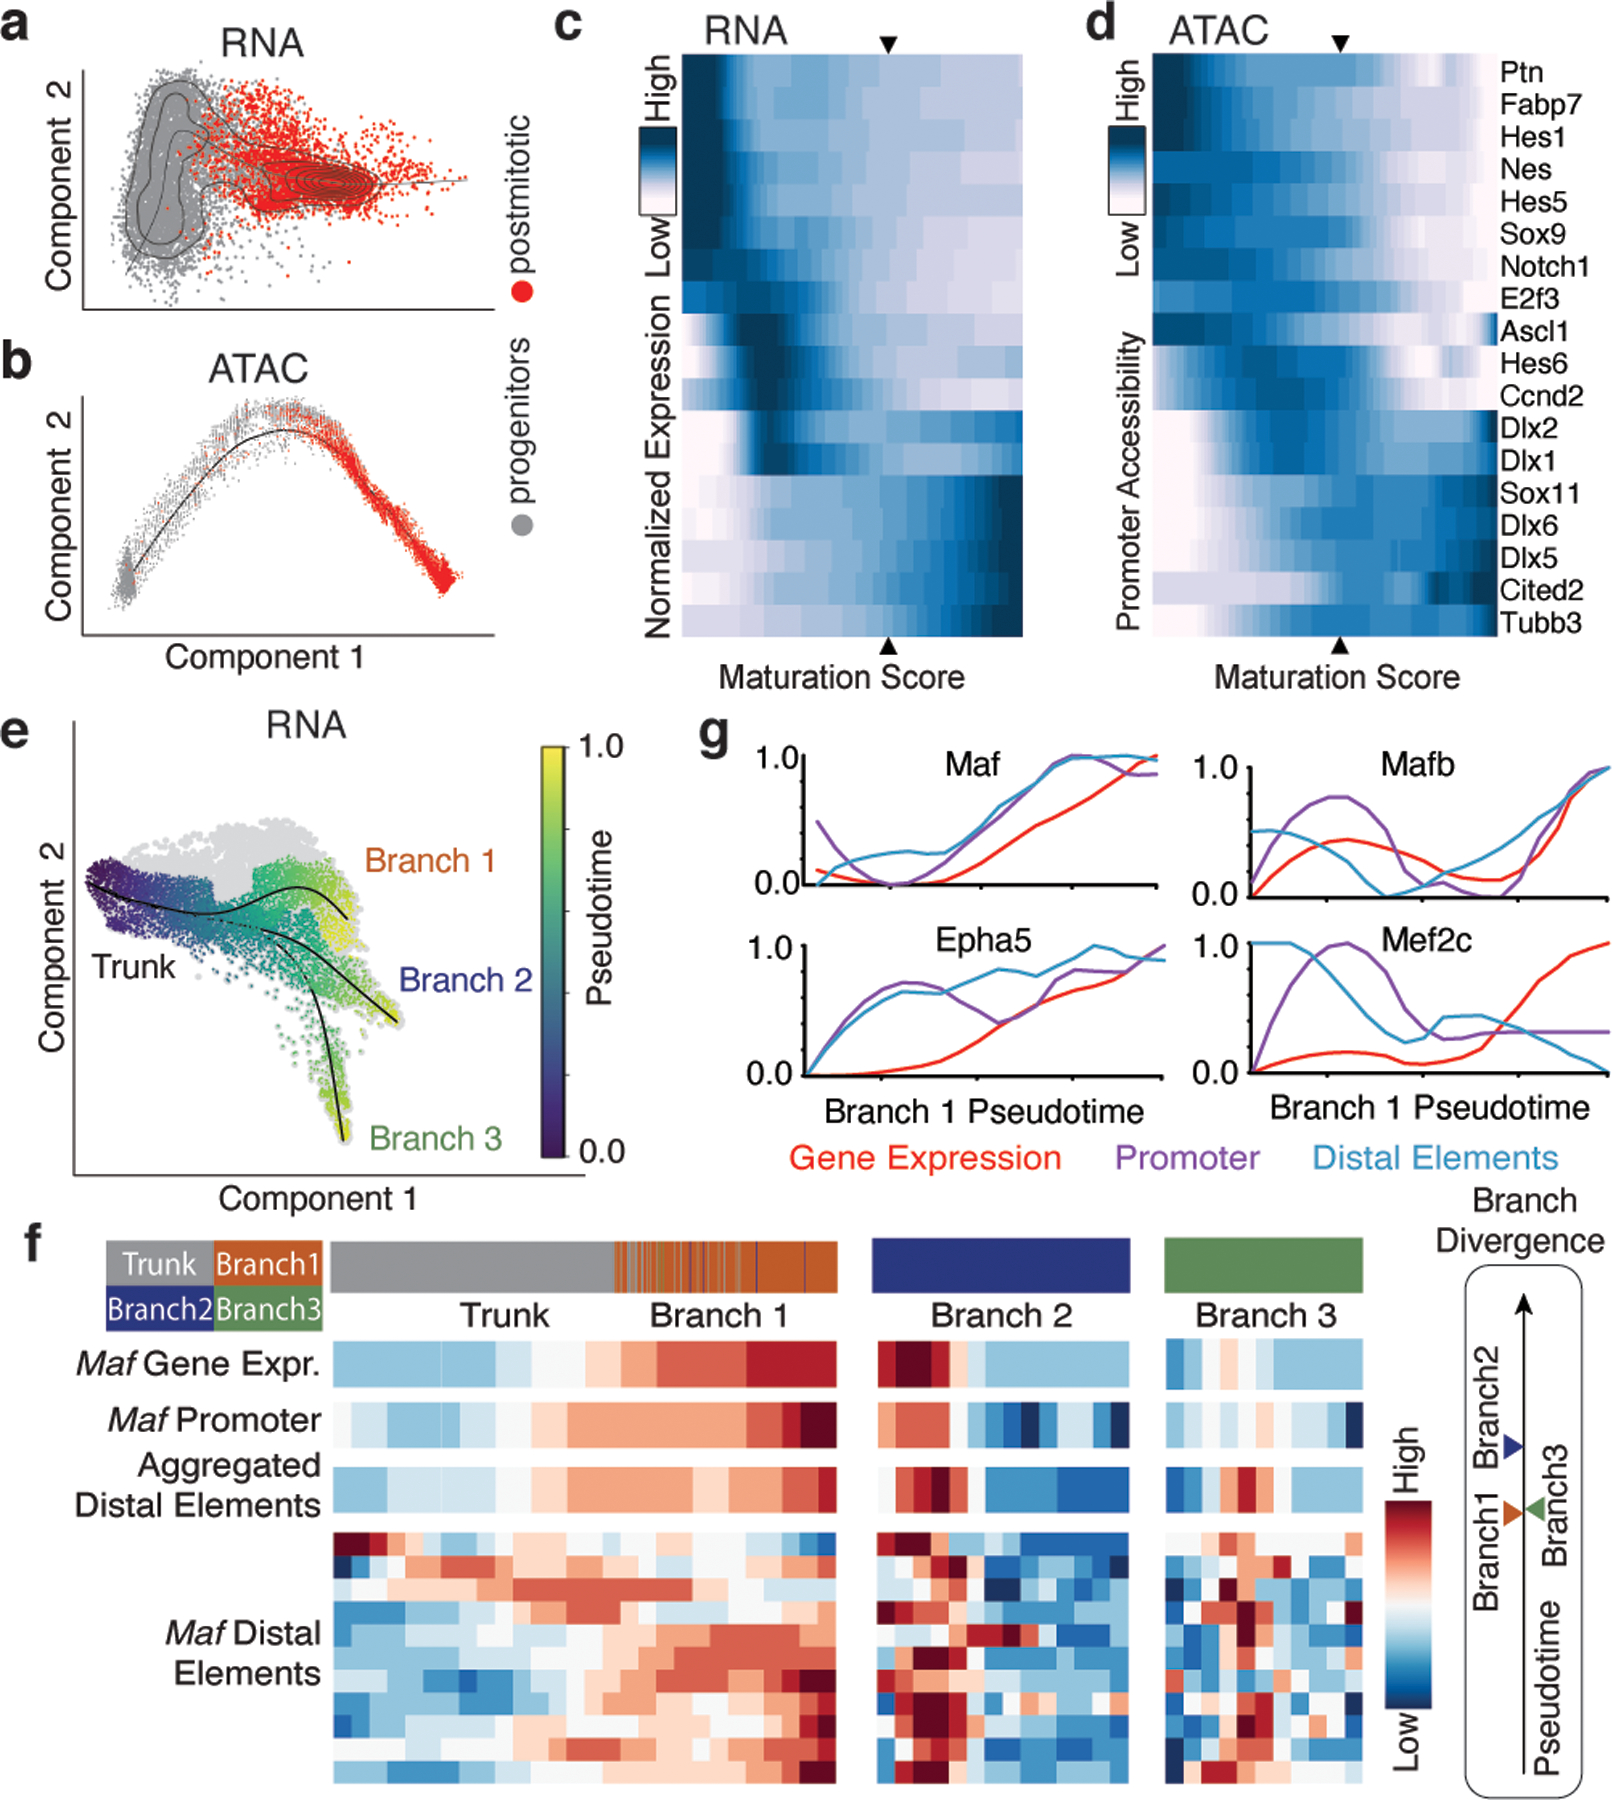
Figure 1: Distal chromatin elements provide the earliest markers of interneuron identity.

a and b, Diffusion maps of MGE cells using scRNA- (a) and scATAC-seq (b). Cells order into a maturation trajectory with both methods.
c and d, RNA expression of maturation-relevant genes (c) and the corresponding promoter accessibility (d) across the maturation trajectory. Scale denotes normalized row-scaled expression or promoter accessibility. Arrowheads indicate the mitotic/postmitotic transition.
e, Diffusion map analysis of scRNA-seq data from postmitotic MGE revealed three distinct branches: Branch 1-interneurons, Branch 2 & 3-projection.
f, Detailed analysis of the Maf locus for gene expression, promoter and aggregated accessibility of distal elements shown for early postmitotic (trunk) and branch-specific cells. Bottom heatmaps show Maf distal elements compared for their accessibility across branches. Timeline (right) indicates the earliest time at which each branch can be distinguished by gene expression.
g, Gene expression (red), promoter accessibility (green), and aggregated accessibility of distal elements (blue) for four branch 1 marker genes across the pseudotime.
