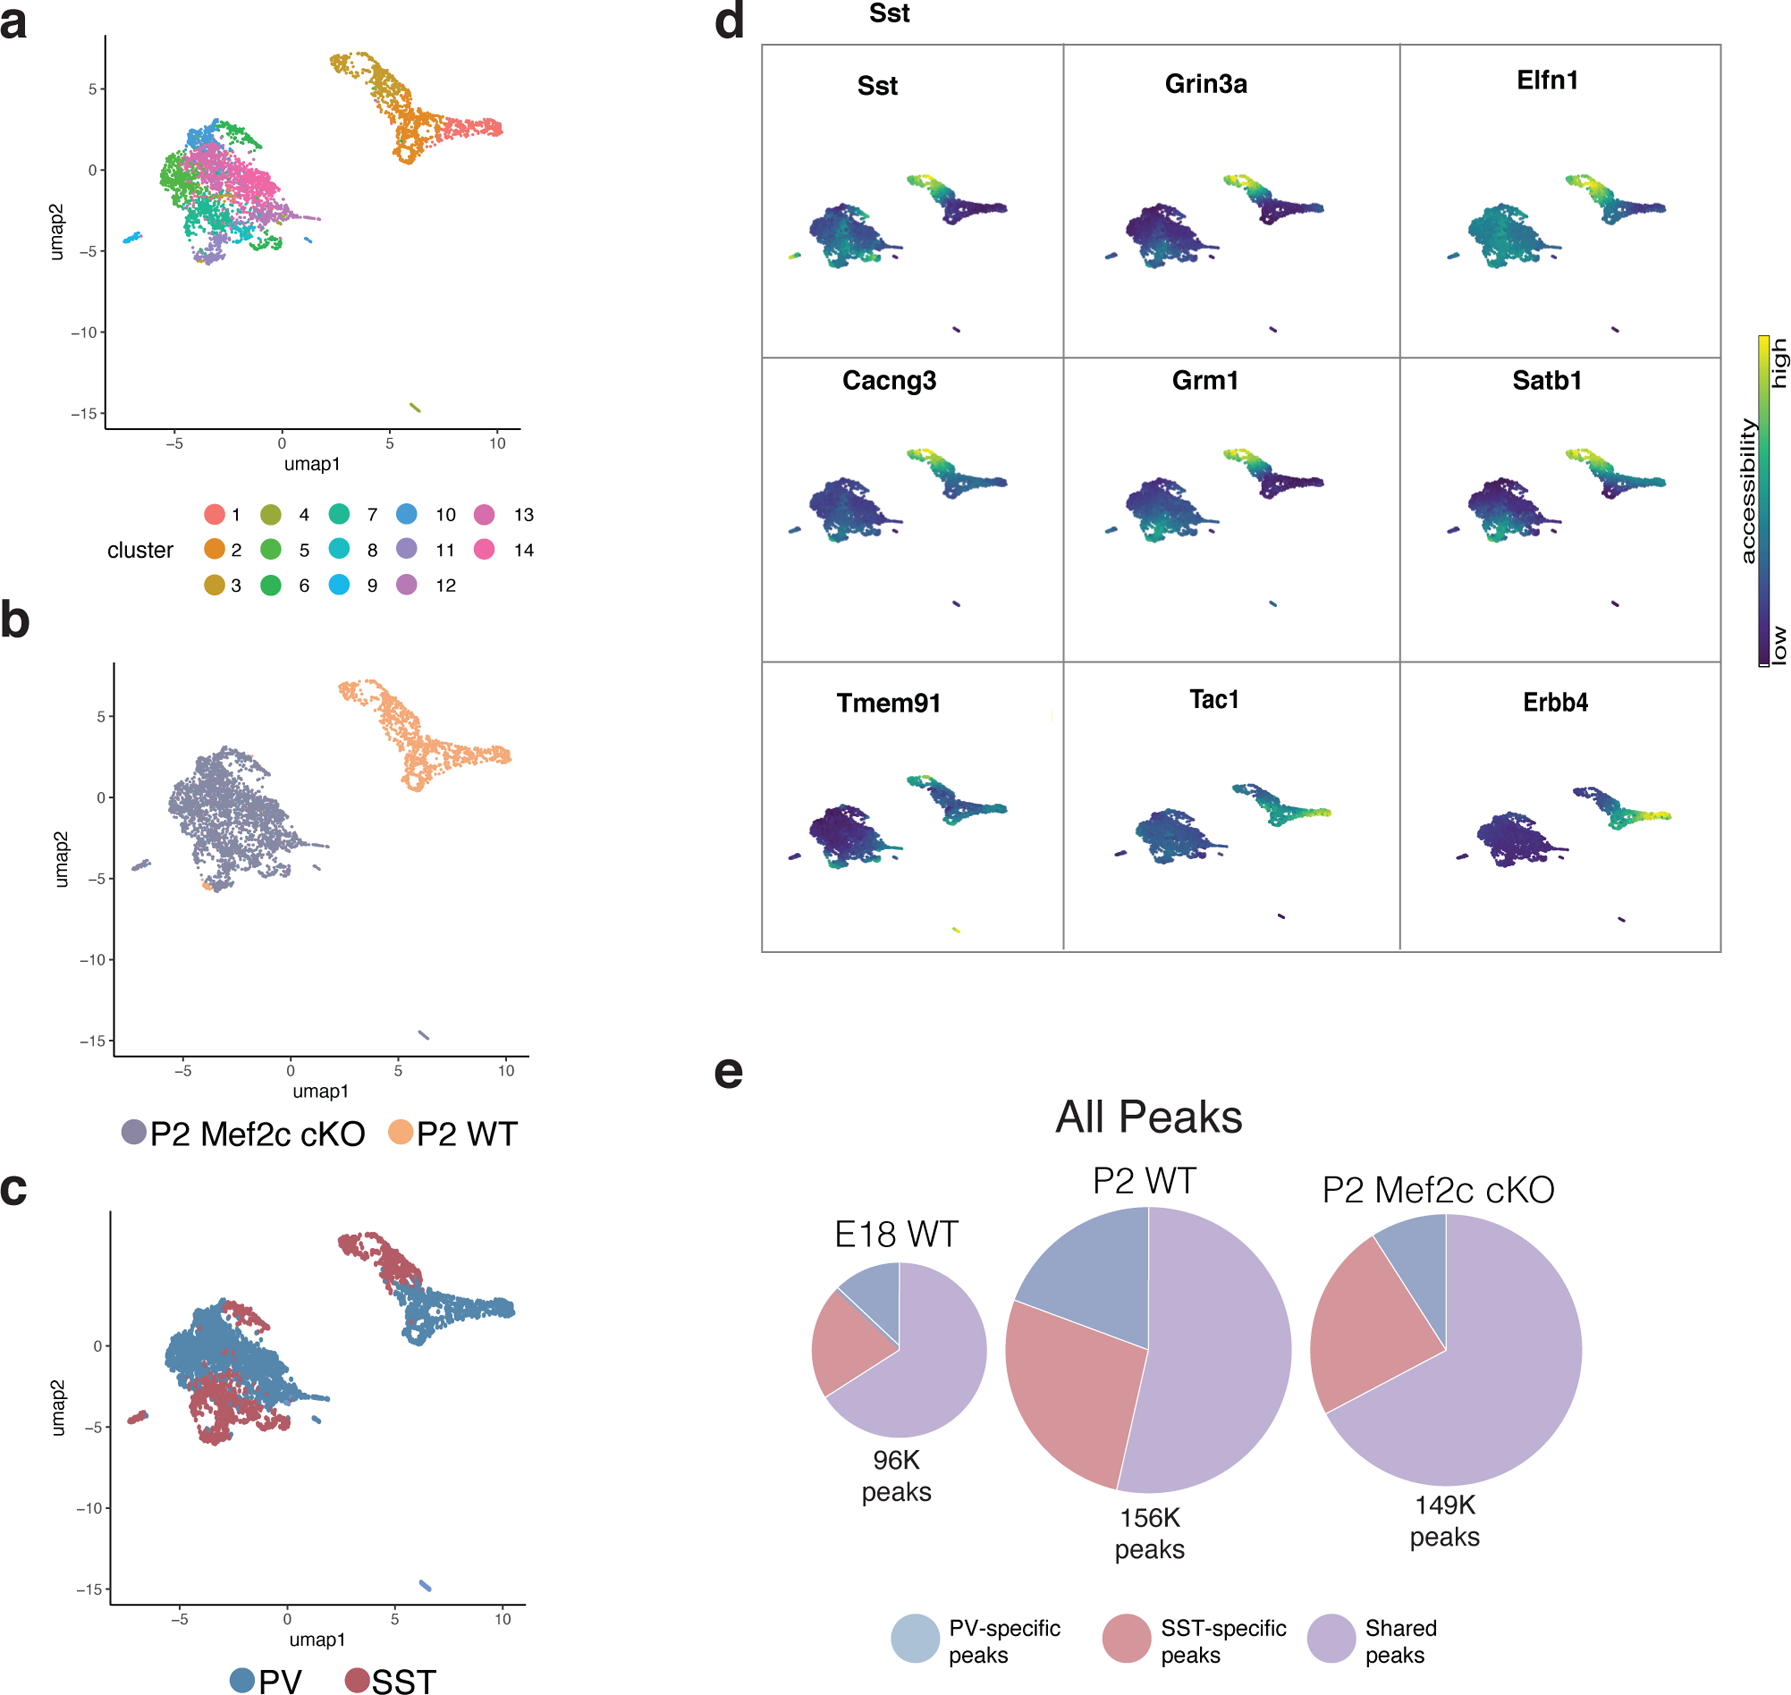
Extended Data Figure 10: Single-cell RNA- and ATAC-seq analysis of Mef2c cKO interneurons compared to wild-type (WT) cells at P2.

a, UMAP of P2 WT snRNA-seq and P2 Mef2c cKO snRNA-seq data integrated using Seurat and color-coded by cluster identity. WT dataset here was prepared using single nuclei to match cKO rather than the whole cell dataset (see Fig. 4).
b, UMAP in (a) segregated according to timepoint and color-coded by cell type.
c, Cluster composition delineated by (i) marker gene expression (ii) cell type (iii) cell number. Compare a-c here with Fig.4 a–c - this figure contains single nucleus data for both WT and cKO while Fig 4 WT data is whole cell.
d, UMAP of Mef2c cKO and WT cells color-coded by cluster.
e, UMAP of Mef2c cKO and WT cells color-coded by genotype.
f, UMAP of Mef2c cKO and WT cells color-coded by cardinal class identity. Mef2c cKO identity was determined by the accessibility of marker genes (see d) and assignment of clusters to the appropriate cardinal class.
g, Gene body accessibility of SST and PV cIN marker genes (SST: Sst, Grin3a, Elfn1, Cacng3, Grm1, Satb1, Tmem91. PV: Tac1, Erbb4).
h, Pie chart representation of scATAC-seq data showing the total number of peaks in E18 WT, P2 WT, and P2 Mef2c cKO, subdivided into peaks that are PV or SST cell specific or shared across both cell types. Compare to Figure 4d, which shows similar pie charts but only for peaks with Mef2c motifs.
