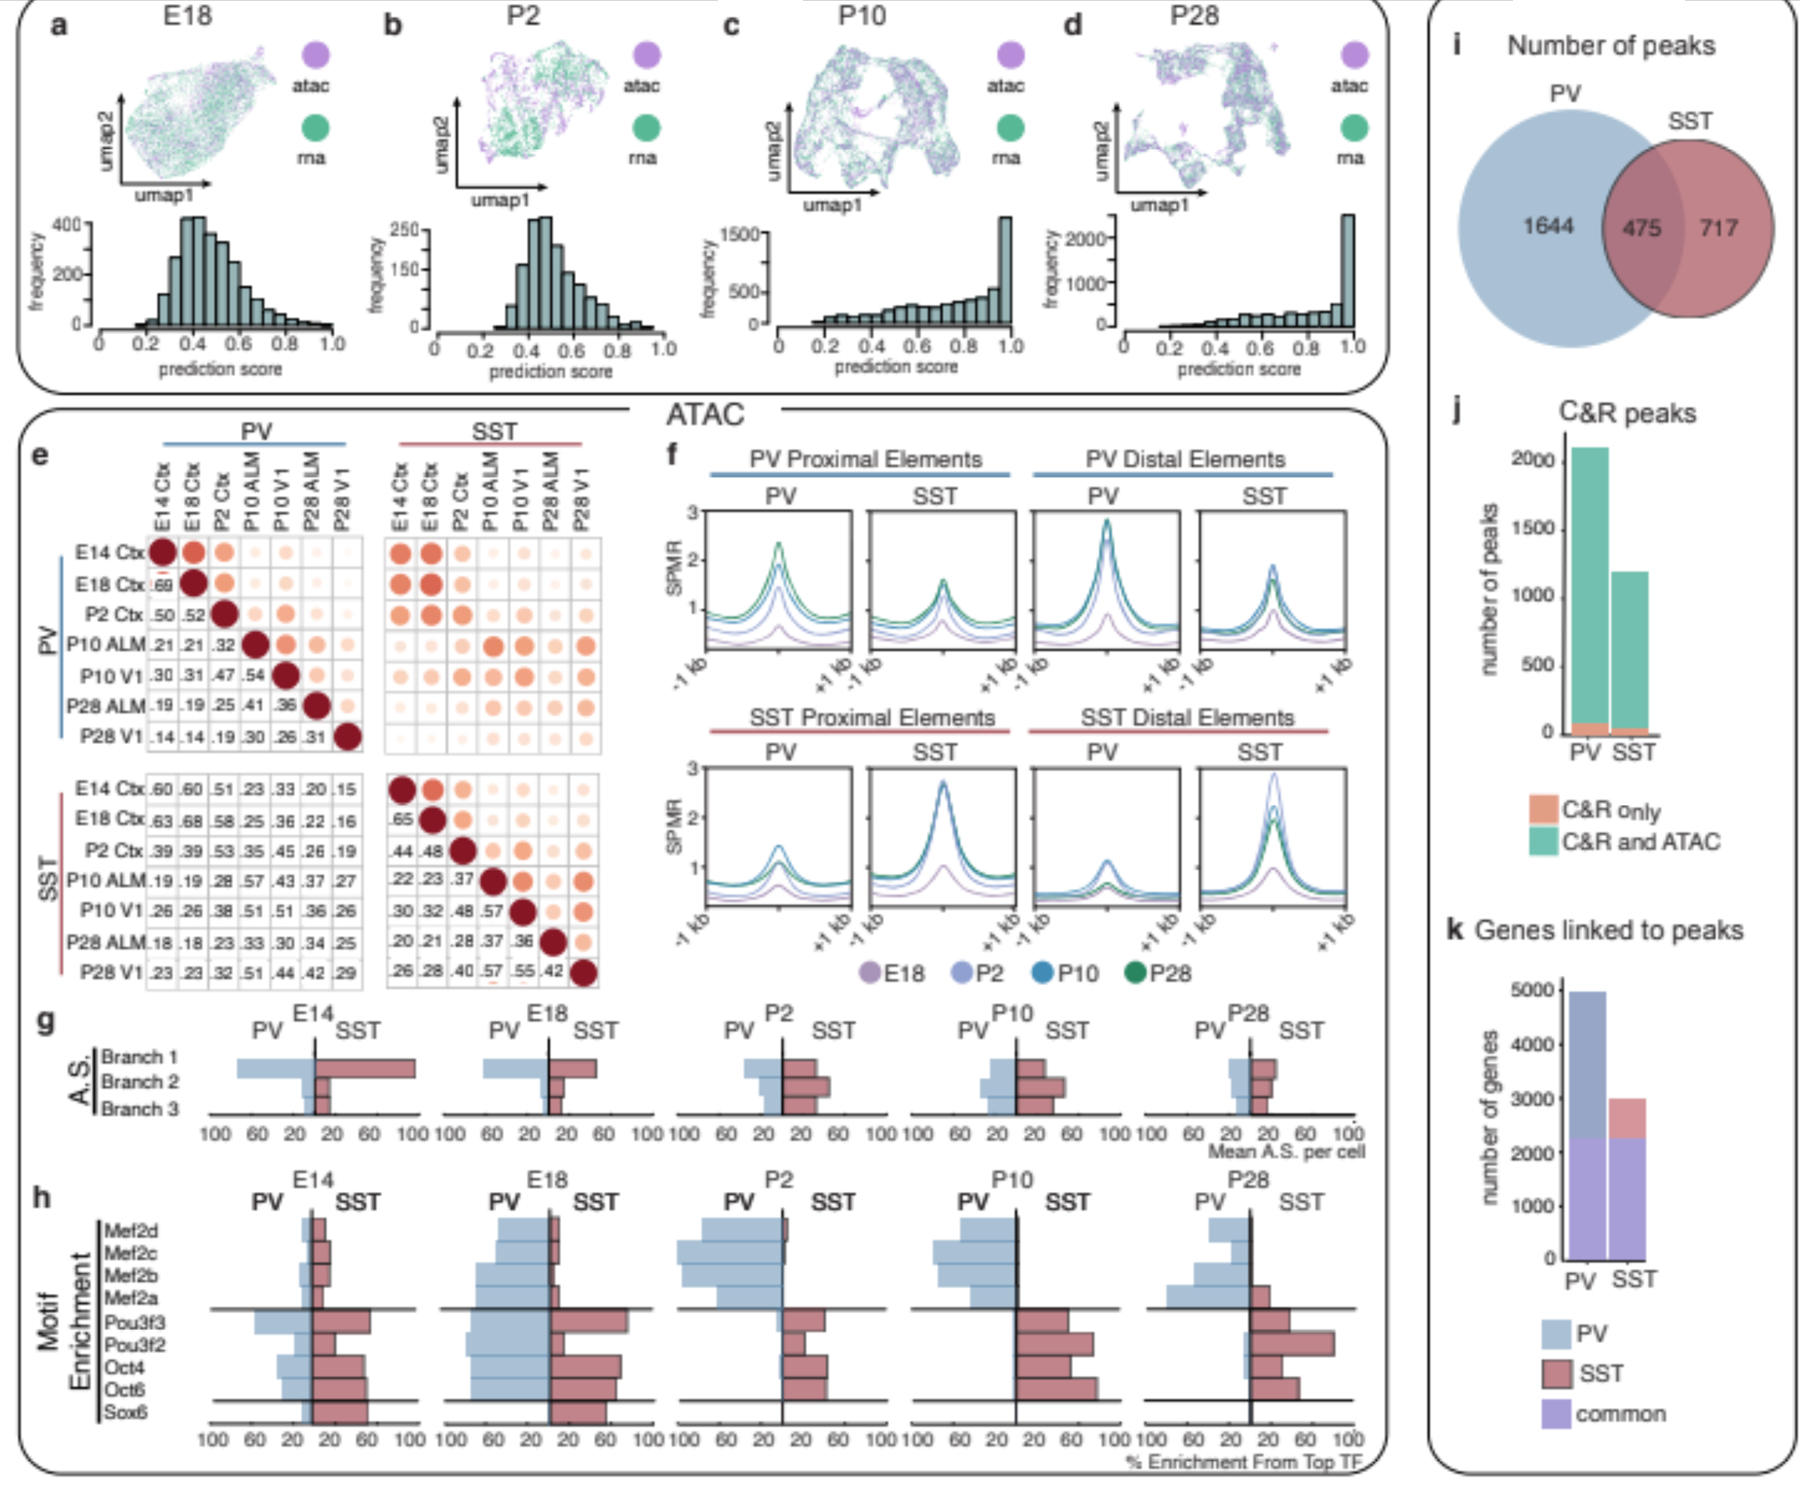
Figure 2: Remodeling of interneuron chromatin architecture during migration and post-settling.

a,b,c,d UMAP of coembedded scRNA- and scATAC-seq data (top) and prediction scores of scATAC-seq assignment to scRNA-defined clusters (bottom) at E18 (a), P2 (b), P10 (c), P28 (d).
e, Jaccard distance analysis for PV and SST cell scATAC-seq peaks across timepoints.
f, Average signal within cell type-specific accessible peaks identified at P28 located for proximal elements (gene bodies or promoters: TSS+/−2kb) or distal elements across timepoints.
g, Aggregated scores (AS) for branch-specific peaks.
h, Motif enrichment (ME) in class-specific loci at each timepoint. Each TF enrichment value is normalized by the largest enrichment value in the population.
i, Relative distribution of P28 MEF2C CUT&RUN peaks in PV versus SST interneurons.
j, Peaks identified exclusively in CUT&RUN (orange) or jointly in CUT&RUN and ATAC-seq analyses (green).
k, Number of genes linked to CUT&RUN peaks found uniquely in PV (blue), SST (red) or shared in both populations (purple). Peaks were assigned to genes based on scATAC co-accessibility with promoters.
SPMR, signal per million reads; ME, Motif Enrichment; AS, Aggregated Score; C&R, CUT&RUN
