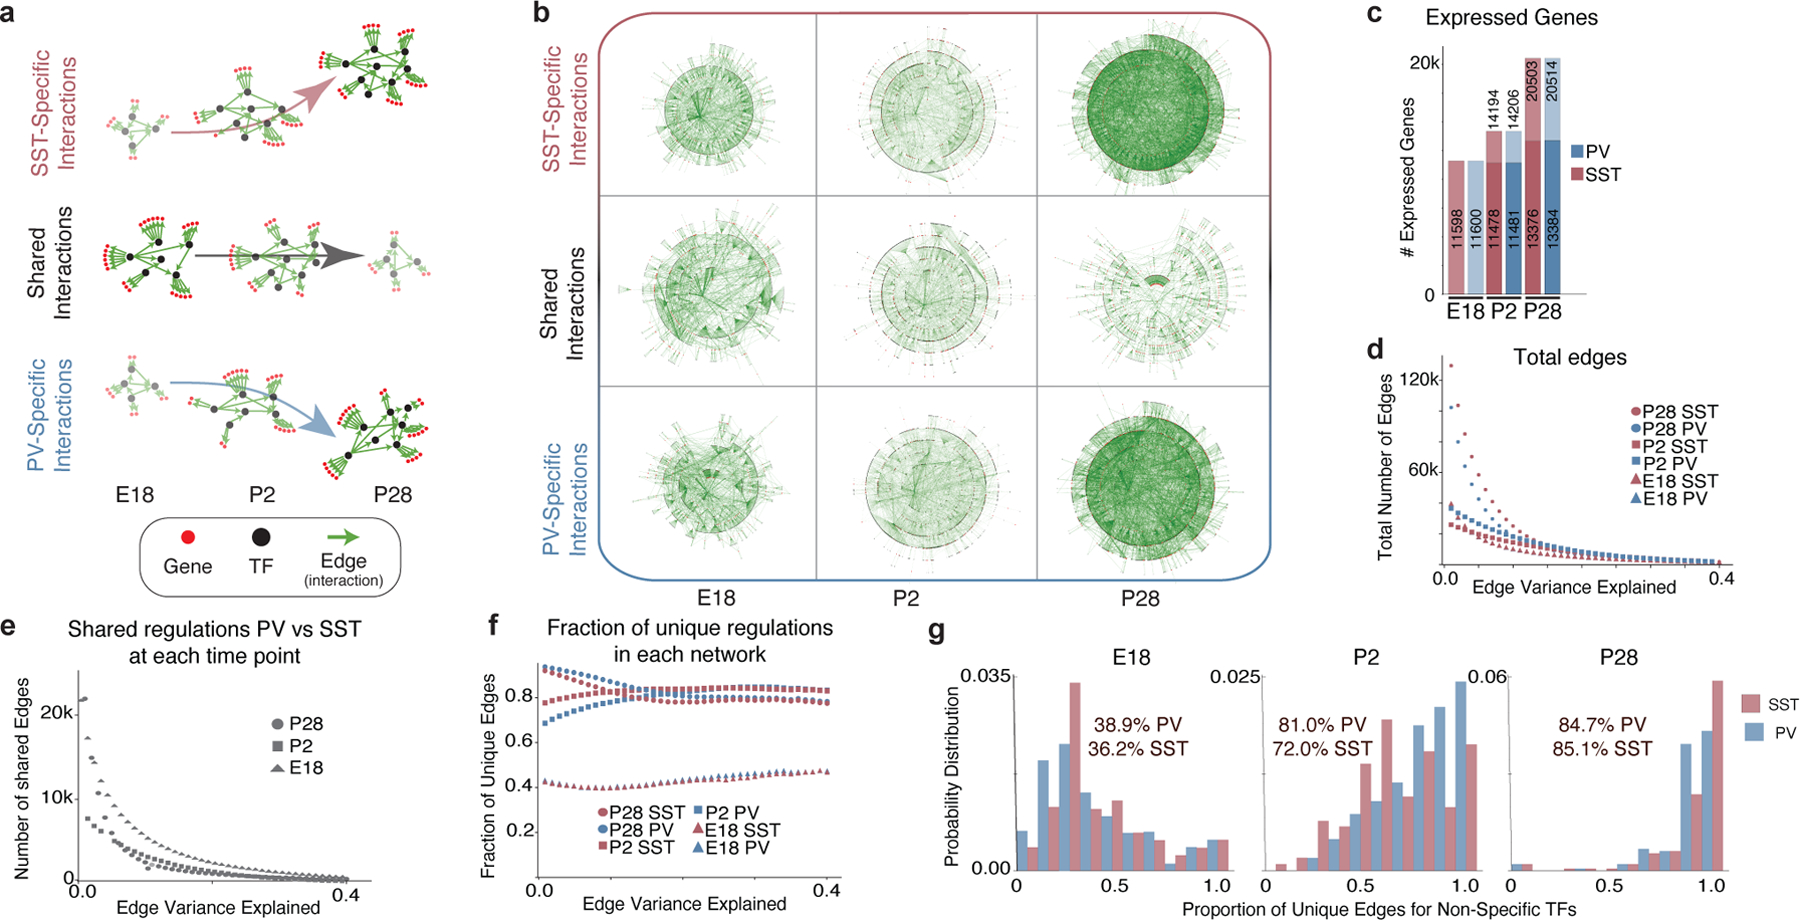
Figure 3: The maturation of gene networks is characterized by the emergence of cell type-specific regulatory interactions.

a, Schematic illustrating key findings of the GRN analysis. Early in development, shared TFs generally target the same genes in both PV and SST cells. By adulthood, cell type-specific programs take over, with TFs regulating genes in a cell type-specific manner.
b, Graphical representation of unique and common gene regulatory edges constructed using GRN analysis. Edges that explain at least 0.05% of the target’s variance are included. Each edge (green line) connects a TF (black dot) to a target gene (red dot) or another TF.
c, Total number of genes detected in PV and SST interneurons at each timepoint. For P2 and P28, gene expression is divided into maintained from the earlier timepoint (bottom) versus newly expressed (top). Genes with <10 counts across all cells were excluded.
d, Number of edges at each timepoint. Note: In d-f, the x-axis represents the edges that explain up to a certain value of its target’s variance.
e, Edges shared between PV and SST.
f, Proportion of the GRN unique to PV or SST cells at each age.
g, The proportion of unique targets of common TFs. TFs were considered common if they had an absolute LFC ≤0.25 and expressed in >10% of both PV and SST cells. Statistics within graphs represent the mean percentage of unique edges per common TF.
