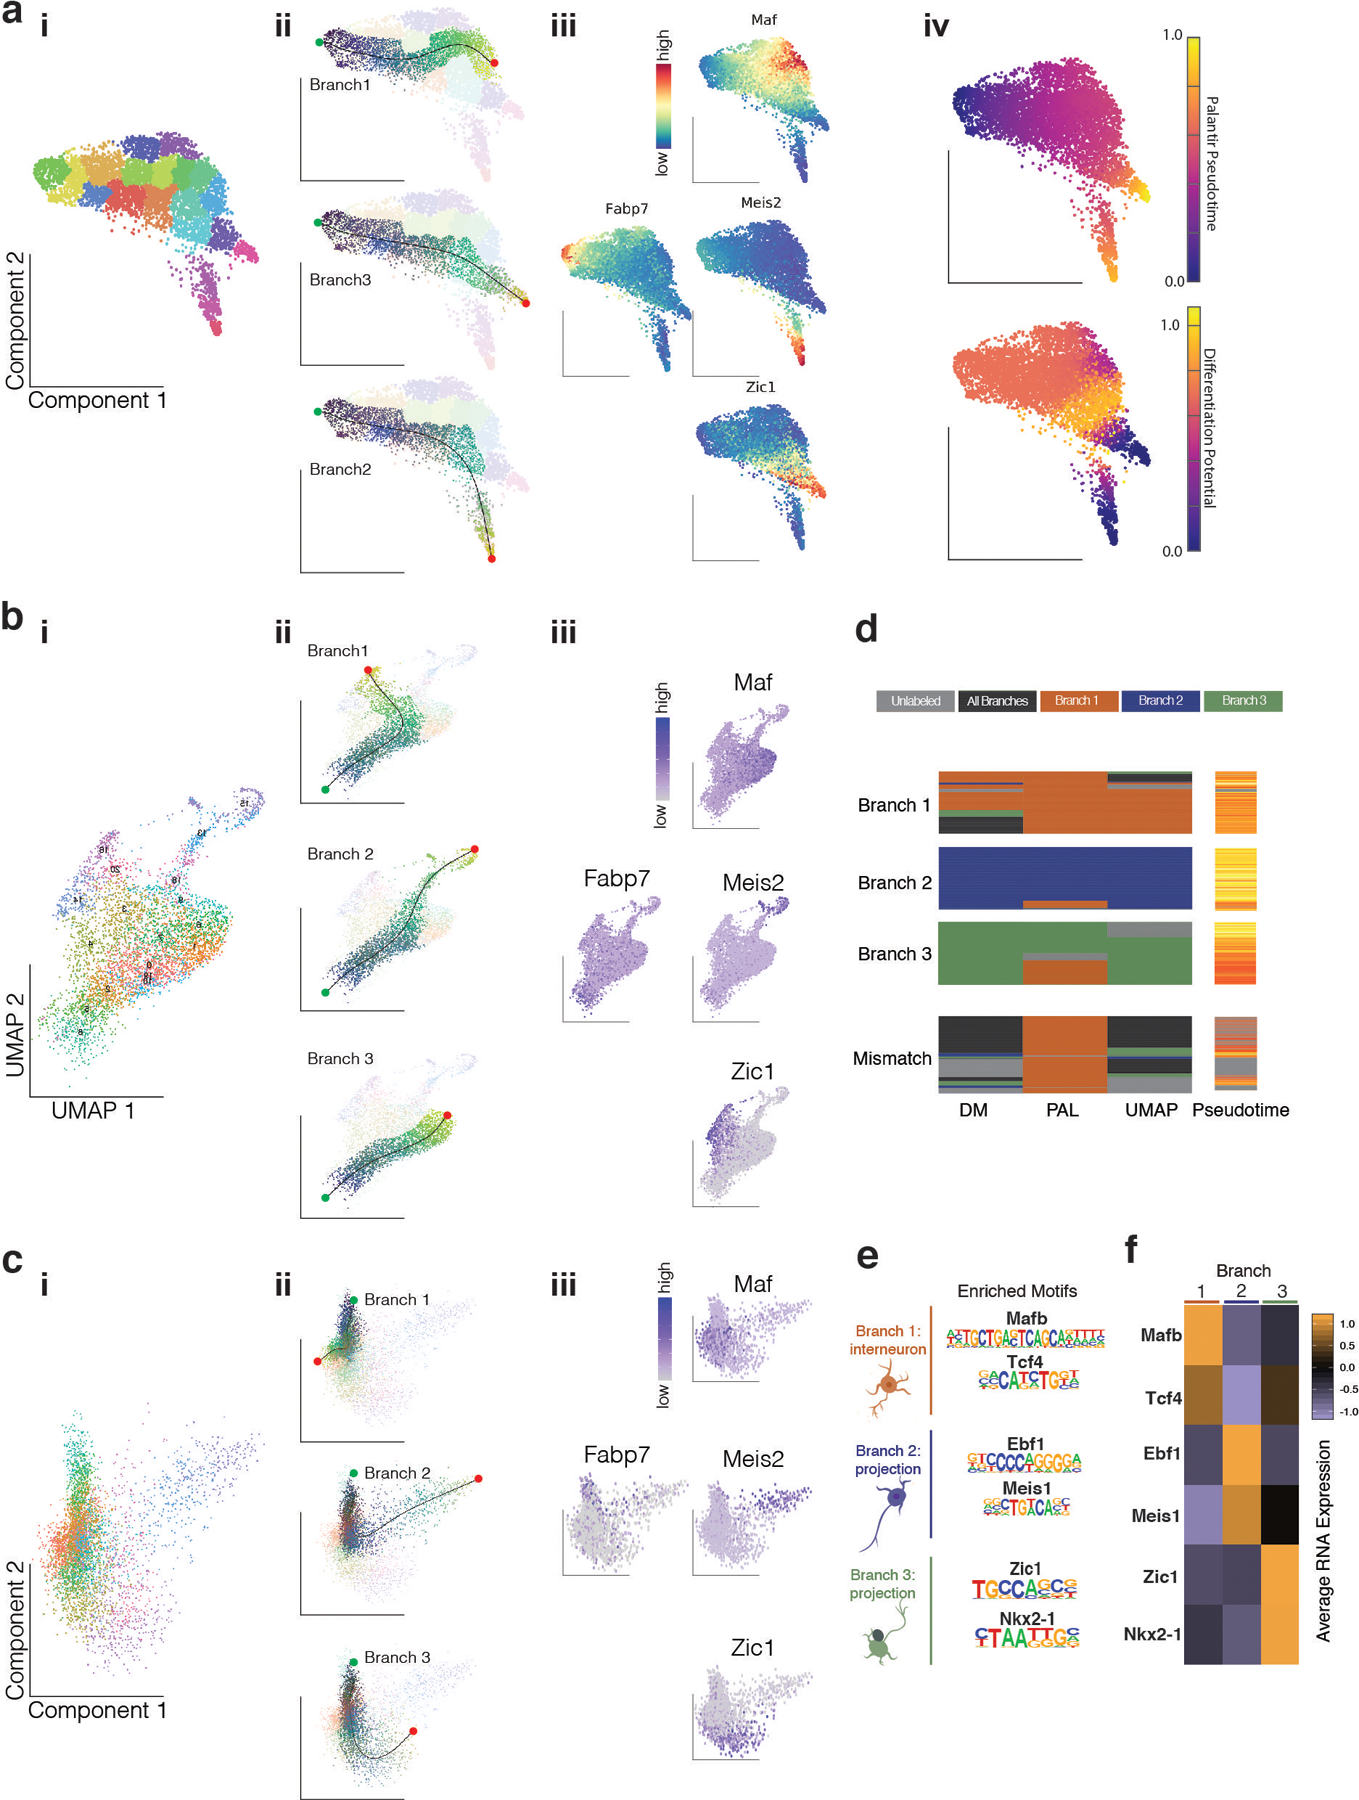
Extended Data Figure 3. Orthogonal maturation trajectory methods reveal branching fates in postmitotic MGE cells at E13.

a, Palantir Analysis of Analysis of Dlx6a−, Dlx6a+ and multiome scRNA-seq postmitotic cells.
b, UMAP Analysis of Analysis of Dlx6a−, Dlx6a+ and multiome scRNA-seq postmitotic cells.
c, Diffusion Maps Analysis of Analysis of Dlx6a−, Dlx6a+ and multiome scRNA-seq postmitotic cells.
For a, b, c:
i, Unbiased clustering annotation.
ii, Branch trajectories color-coded by slingshot pseudotime.
iii, Gene expression for mitotic marker (Fabp7) and branch-specific marker (Zic1, Meis2, Maf).
iv, For Palantir, cells are color coded by Palatir Pseudotime or Differentiation Potential.
d, Confusion matrix reveals agreement of branch labels between different trajectory methods.
e, TFs with binding motif highly enriched in a branch specific manner.
f, Average gene expression across branches for TFs in e.
