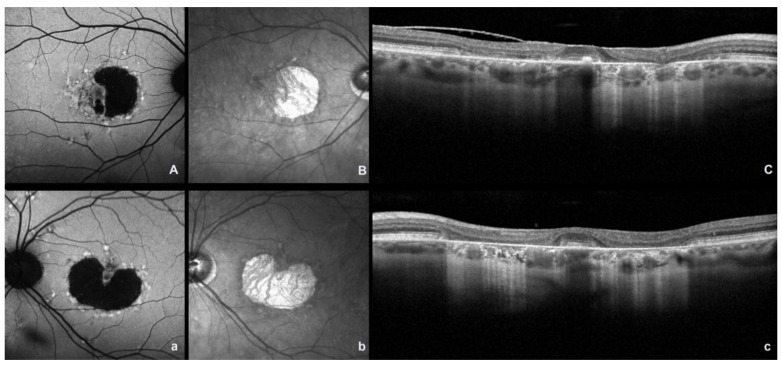
Figure 2.
Fundus autofluorescence (FAF), near-infrared reflectance (NIR), and spectral domain optical coherence (SDOCT) images in a patient with bilateral molecularly confirmed ABCA4 Stargardt disease in an advanced stage. (A,a) FAF image showing a diffuse area of macular hypoautofluorescence with surrounding hyperautofluorescenct flecks; (B,b) NIR image showing a central macular hyporeflective area (atrophy area) surrounded by dotted hyperreflectivity (flecks); (C,c) SDOCT scan showing the absence of the outer retinal layer with diffuse backscattering (uppercase and lowercase letters indicate the right and left eye, respectively).

