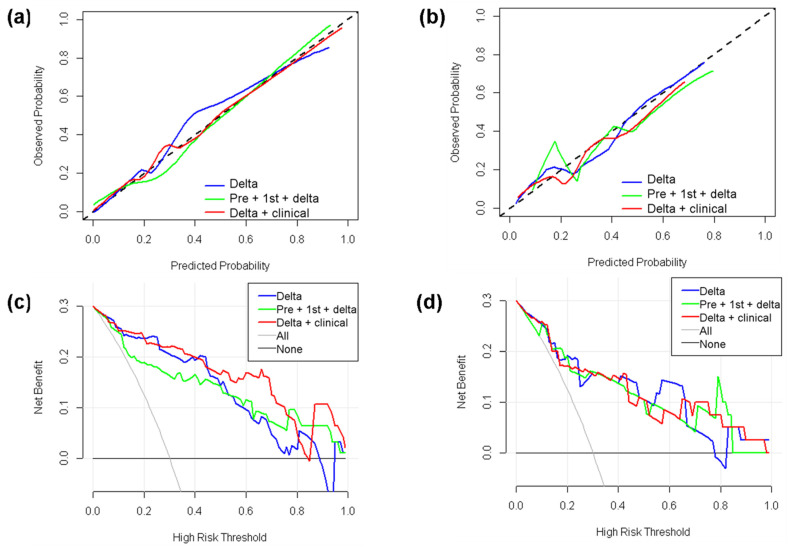
Figure 5.
Calibration curves and decision curve analysis (DCA) for the optimal delta-radiomics model, longitudinal fusion-radiomics model, and clinical-radiomics model. (a) Calibration curves for the training cohort. (b) Calibration curves for the validation cohort. The dotted line represents a perfect classification. (c) DCA results for the training cohort. (d) DCA results for the validation cohort. The y-axis represents the net benefit. The solid gray line represents the scenario that all patients were included in the pCR group. The solid black line represents the scenario that no patients were included in the pCR group. The x-axis represents the threshold probability (i.e., where the expected benefit of the treatment is equal to the expected benefit of avoiding treatment).

