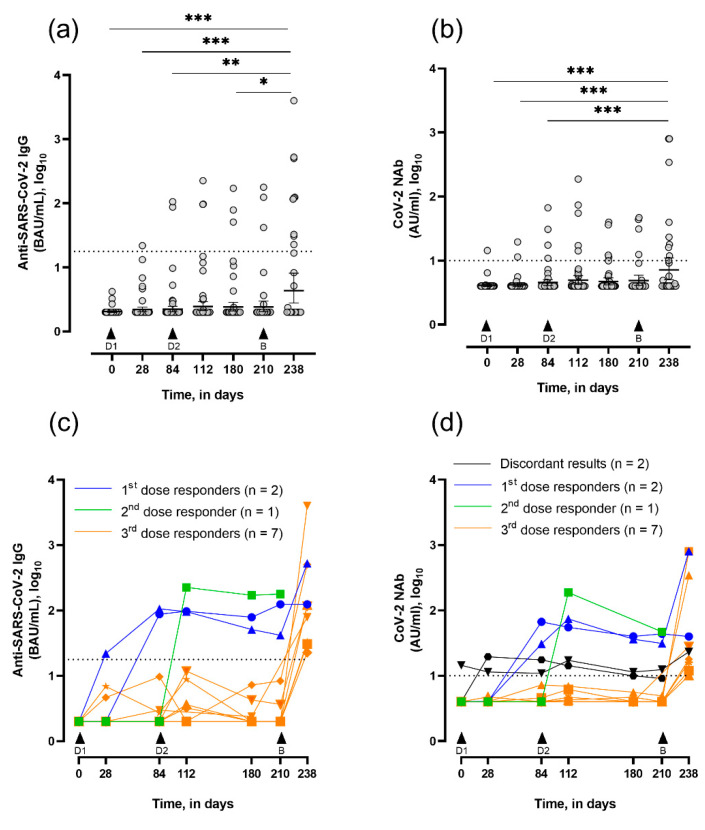
Figure 2.
Evolution of serum SARS-CoV-2 IgG titers and neutralizing capacity in vaccinated LTRs, assessed at days 0 (n = 49), 28 (n = 47), 84 (n = 49), 112 (n = 44), 180 (n = 42), 210 (n = 32) and 238 (n = 28). Data are expressed in log10. (a) Quantitative titers of anti-SARS-CoV-2 IgG at consecutive timepoints (geometric mean in BAU/mL ± 95% CI). * p <0.05, ** p <0.01, and *** p <0.001 by the Kruskal–Wallis test followed by a post–hoc Dunn’s tests. (b) Quantitative titers of neutralizing antibodies (NAbs) at consecutive time-points (geometric mean in AU/mL ± 95% CI). *** p <0.001 by the Kruskal–Wallis test followed by a post hoc Dunn’s tests. (c) Evolution of anti-SARS-CoV-2 IgG titers in seropositive LTRs with first dose responders represented in blue (n = 2), second dose responder in green (n = 1), and booster dose responders in orange (n = 7). (d) Evolution of NAbs titers in seropositive LTRs with first dose responders represented in blue (n = 2), second dose responder in green (n = 1), and booster dose responders in orange (n = 7). Patients with discordant results between IgG and NAbs are represented in black (n = 2). Dotted black lines represent the positivity cut-offs for IgG measurement (≥17.8 BAU/mL, i.e., 1.25 in log10) and for NAbs measurement (≥10 AU/mL, i.e., 1 in log10). D1 and D2, respectively, are the first and second dose of ChAdOx1; B is the booster dose, BNT162b2.

