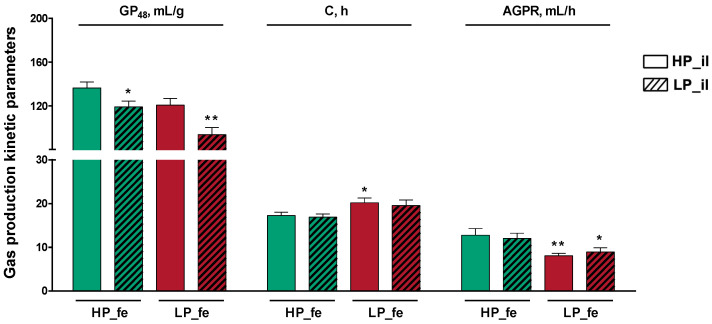
Figure 5.
In vitro gas production kinetics and fermentation characteristics in the culture fluids after 48 h of incubation. Values are the means of 8 observations per treatment. * Significant difference compared with HP_fe + HP_il treatment (p ≤ 0.05); ** Significant difference compared with HP_fe + HP_il treatment (p ≤ 0.01). Values are the least-squares means ± SD; n = 8. Green bar, high-protein diet treatment; red bar, low-protein diet treatment. Abbreviations: HP_il, high-protein diet treatment ileal digesta; LP_il, low-protein diet treatment ileal digesta; HP_fe, high-protein diet treatment feces; LP_fe, low-protein diet treatment feces; GP48, gas production in 48 h; C, half-time of asymptotic gas production; AGPR, average gas production rate between the start of the incubation and the time at which the cumulative gas production was half that of its asymptomatic value.

