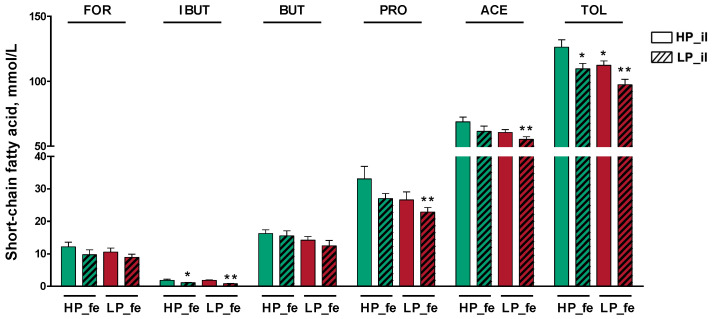
Figure 6.
Quantification of the short-chain fatty acids in the fermentation supernatants. Values are the means of 8 observations per treatment. * Significant difference compared with HP_fe + HP_il treatment (p ≤ 0.05), ** Significant difference compared with HP_fe + HP_il treatment (p ≤ 0.01). Values are the least-squares means ± SD; n = 8. Green bar, high-protein diet treatment; red bar, low-protein diet treatment. Abbreviations: HP_il, high-protein diet treatment ileal digesta; LP_il, low-protein diet treatment ileal digesta; HP_fe, high-protein diet treatment feces; LP_fe, low-protein diet treatment feces; FOR, formate; IBUT, isobutyrate; BUT, butyrate; PRO, propionate; ACE, acetate; TOL, total short-chain fatty acids.

