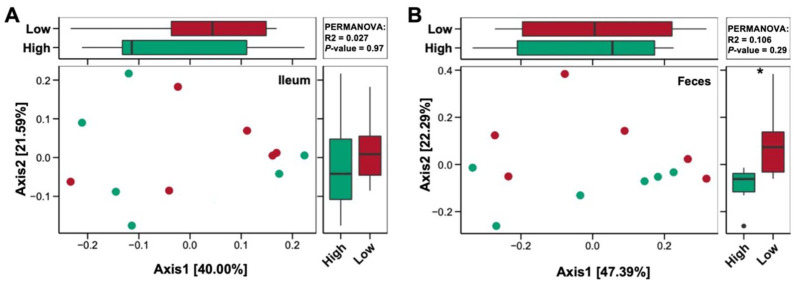
Figure 9.
Principal coordinate analysis. Principal coordinate analysis of the microbiota from the ileal digesta (A) and feces (B) of pigs fed a high-protein diet (green points and green boxes) or a low-protein diet (red points and red boxes); n = 6. The distances between the symbols on the ordination plot reflect the relative dissimilarities in the community structures.

