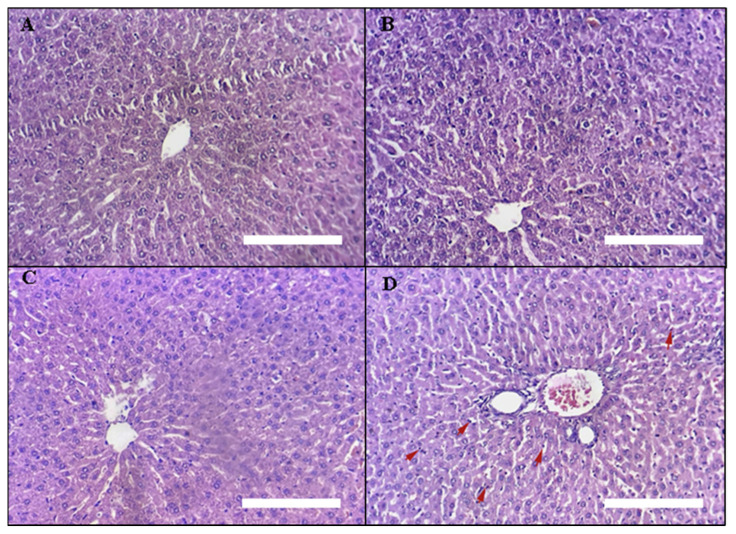
Figure 9.
Liver histopathology. Light micrographs of liver sections of different treatment groups. The treatment groups are represented by the numbers on the photos. (A) untreated rats, (B) rats treated with5 mg/kg DAHE, (C) rats treated with 50 mg/kg DAHE, and (D) rats treated with 500 mg/kg DAHE. Red arrows = inflammatory cells (granulocytes and lymphocytes).White scale bar = 1.03 mm.

