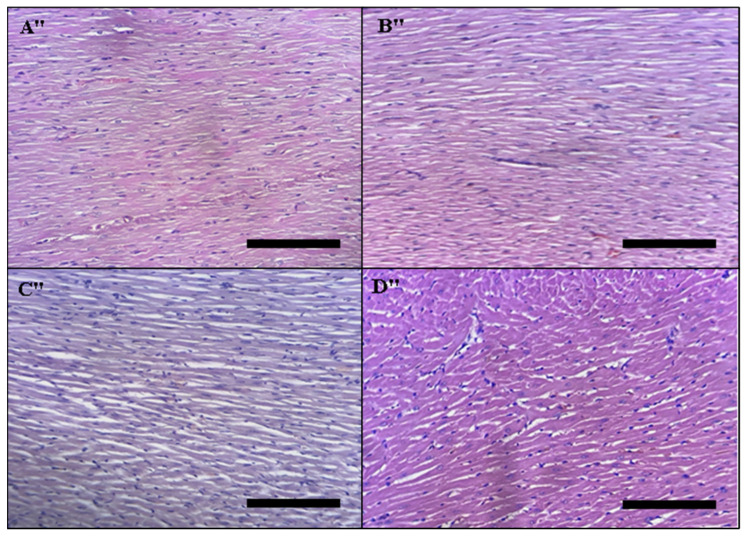
Figure 11.
Histopathology of the heart. Light micrographs of heart slices of different treatment groups. The treatment groups are represented by the numbers on the photos. (A″) Untreated rats, (B″) rats given the DAHE (5 mg/kg), (C″) rats treated with the DAHE (50 mg/kg), and (D″) rats treated with the DAHE (500 mg/kg).Black scale bar = 1.03 mm.

