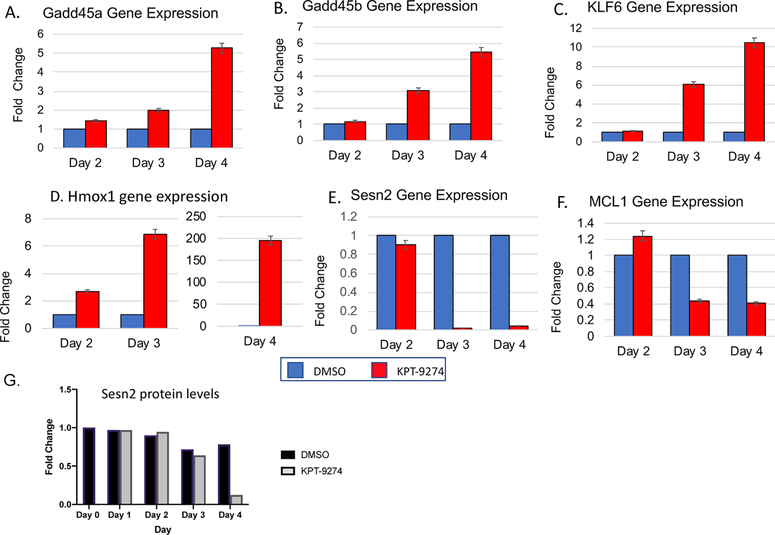
Figure 3.
(A–F) q-PCR analysis of differentially expressed genes (GADD45a, GADD45b, KLF6, HMOX1, SESN2, and MCL1) is consistent with RNA-sequencing results. q-PCR was carried out at the indicated time points after exposure to either DMSO (control) or KPT-9274 for 2, 3, or 4 days. Experiments were done either 2 or 3 times for each condition and done in triplicate. Fold differences relative to DMSO treated (control) cells which were set to 1 (blue bars) are shown for each time point. The HMOX1 results are shown on two separate graphs because of the large change seen on day 4. (G) SESN2 protein expression is verified by Western blot analysis and quantified.

