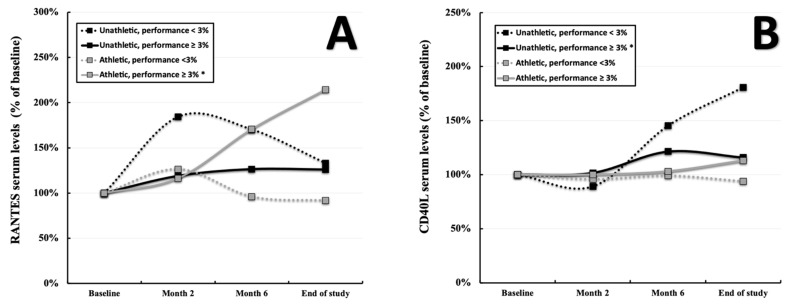
Figure 2.
Progression of RANTES (A) and CD40L (B) serum levels within the subgroups α (initial performance < 100%, performance gain ≤ 2.9%, n = 9), β (initial performance < 100%, performance gain > 2.9%, n = 32), γ (initial performance ≥ 100%, performance gain ≤ 2.9%, n = 18), and δ (initial performance ≥ 100%, performance gain > 2.9%, n = 39) over the course of 8 months. “*” indicates a two-tailed p-value of p < 0.05 comparing the baseline values to those at the end of the study.

