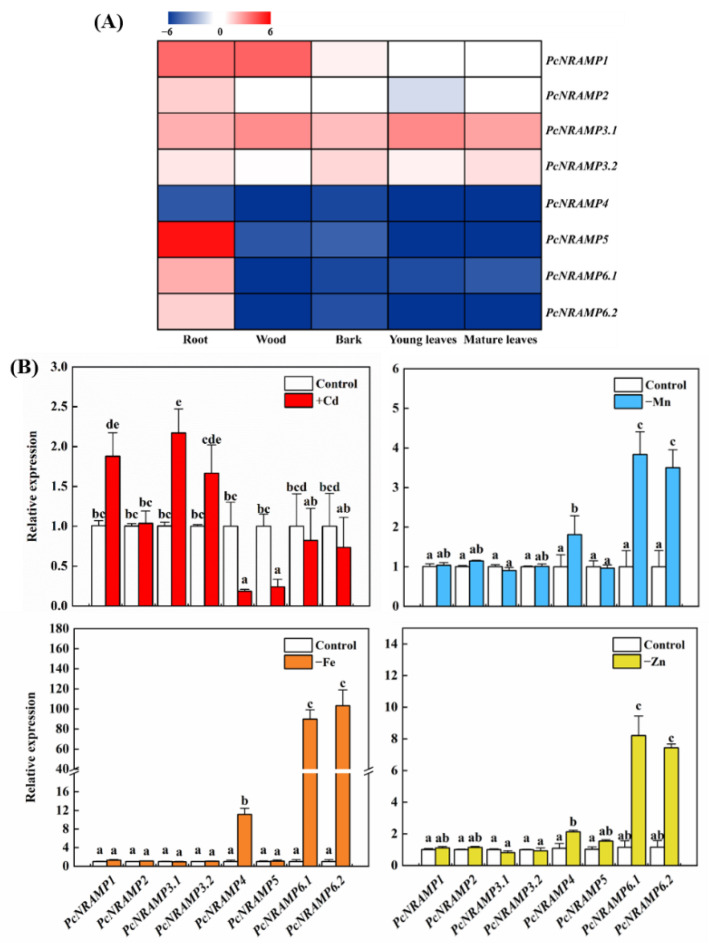
Figure 2.
The expression profiles of PcNRAMP genes. The expression levels of PcNRAMP genes in different tissues without Cd exposure (A) and in the roots (B) of P. × canescens supplied with one-fourth Hoagland solution in combination with either 0 (−Cd) or 100 (+Cd) μM CdCl2, and the deficiency in one of Mn (−Mn), Fe (−Fe) and Zn (−Zn) for 7 days. Bars indicate means ± SE (n = 4). Different letters on the bars indicate significant differences in the relative expression levels among different PcNRAMP genes. In panel (A), the expression level of each PcNRAMP in different tissues was compared with the median of all genes, and the fold change in the expression level of each PcNRAMP was calculated based on the log2 value of its expression level. In panel (B), for each gene, the expression level was set to 1 in the roots of control plants, and the corresponding fold changes were calculated under other treatments.

