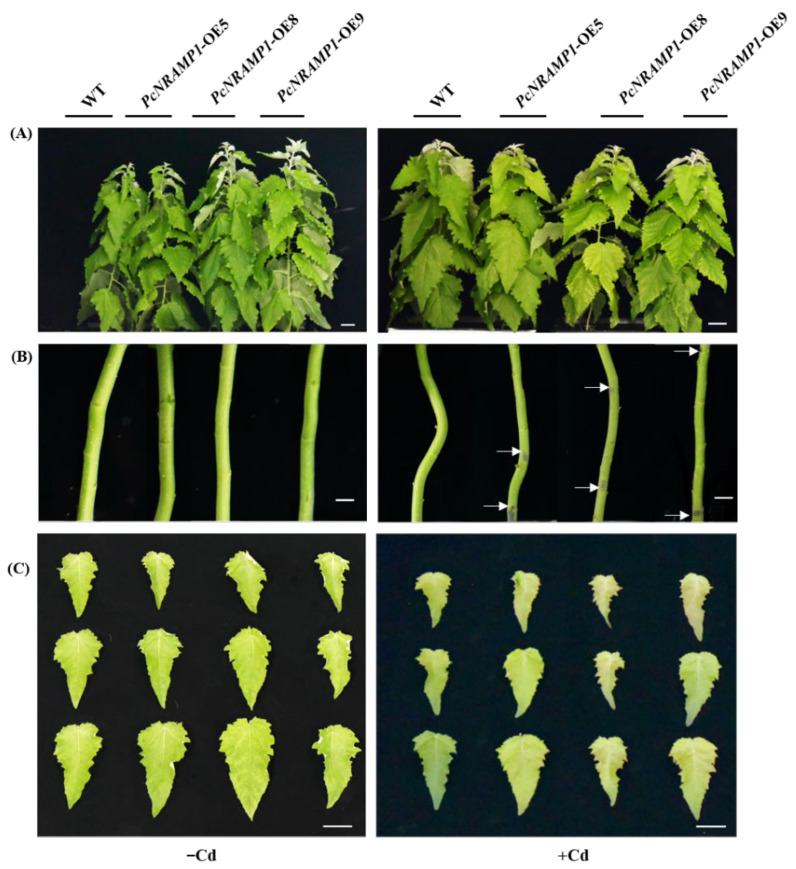
Figure 5.
Growth performance of WT and transgenic lines in response to Cd stress. (A) PcNRAMP1-OE5, PcNRAMP1-OE8, PcNRAMP1-OE9 of P. × canescens treated with either 0 (−Cd) or 100 (+Cd) μM CdCl2 for 2 weeks. (B,C) The phenotypes of the stems and the leaves (LPI = 7–9) of WT and transgenic lines demonstrating Cd toxicity. The arrows in panel B point to black spots. The bars in panels (A–C) indicate 5, 1 and 4 cm, respectively.

