Figure 1.
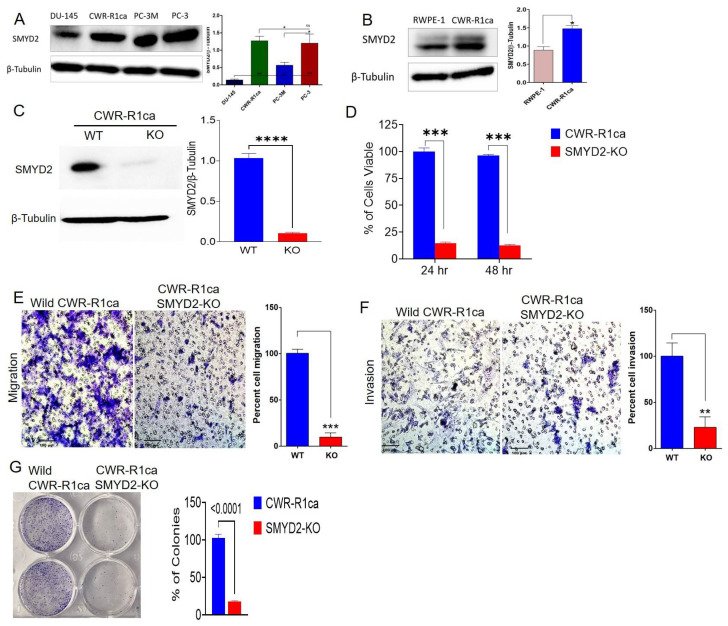
The SMYD2 expression pattern in PC and non-tumorigenic prostate cell lines and its critical contribution to the mCRPC CWR-R1ca cells’ proliferation, migration, invasion, and colony formation. (A) Expression pattern of SMYD2 in mCRPC and AI PC cell lines. (B) Comparison of the expression levels of SMYD2 in the non-tumorigenic RWPE-1 prostatic epithelial cells versus the mCRPC CWR-R1ca cells. Immunoblots show the upregulation of SMYD2 in CWR-R1ca cells compared to RWPE-1 cells. Bar graph represents the densitometric analysis of SMYD2 expression level normalized to β-tubulin in both cells. (C) CRISPR-Cas9-aided successful SMYD2 knockout evidenced by comparing the Western blot of the wild type versus SMYD2-KO CWR-R1ca cell lysates. All raw immunoblots are included in Figure S7. (D) Comparison of the viability of the wild CWR-R1ca versus CWR-R1ca-KO cells in MTT assay over 24 and 48 h. (E) Comparison of the migration ability of the wild CWR-R1ca versus CWR-R1ca-KO cells in wound-healing assay. (F) Comparison of the invasiveness of the wild CWR-R1ca versus CWR-R1ca-KO cells in Matrigel invasion assay. (G) Comparison of the colony formation of the wild CWR-R1ca versus CWR-R1ca-KO cells in colony formation assay. SMYD2 knockout conferred significant viability, migratory, invasiveness, and colony formation suppression compared with the wild CWR-R1ca cells. Vertical bars indicate the percentage relative to that in the vehicle control. Data represent the mean ± SD (n = 3); Student’s t-test; * p < 0.05, ** p < 0.01, *** p < 0.001, **** p < 0.0001, ns refers to non-statistical significance at p < 0.05 relative to control cells.

