Figure 1.
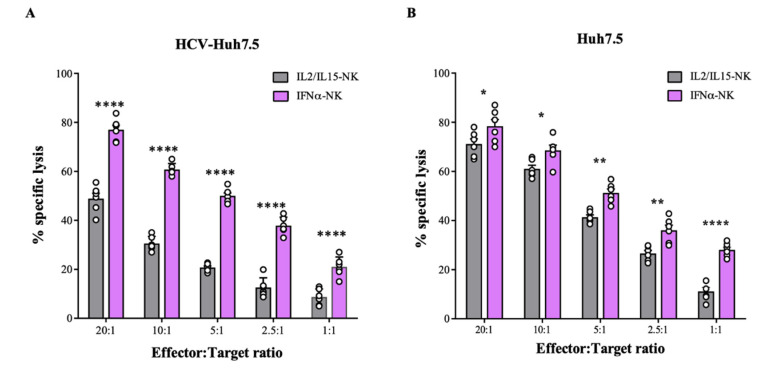
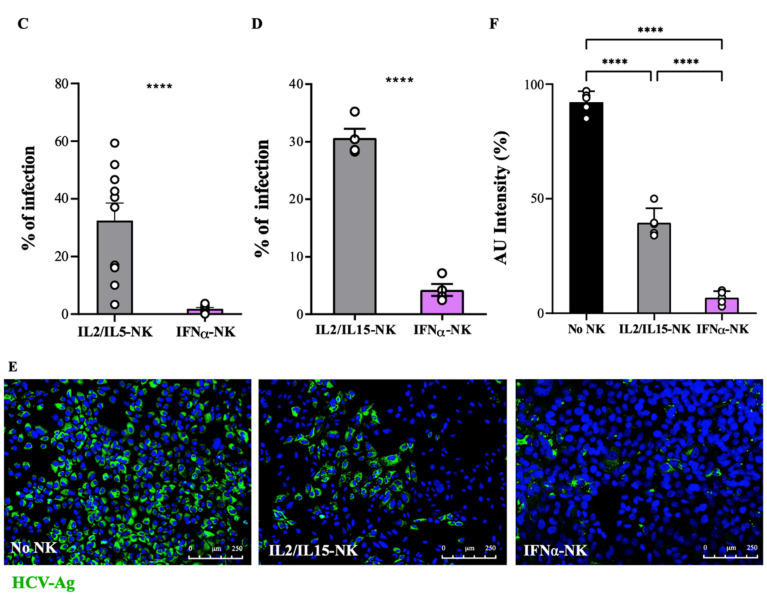
Functional characterization of NK cells activated with IL-2/IL-15 or IFN-α. (A,B) Percentage of lysed target HCV-Hu7.5 (A) or Huh7.5 (B) cells following exposure to decreasing ratios of IL2/IL15-NKs (gray bars) or IFNα-NKs (lilac bars), as calculated with a four-hour chromium release assay. Each dot represents the average of three technical replicates from one donor (n = 6). Mean values ± SEM are shown. (C) Infection rates (percentage of control) of HCV-Huh7.5 cells exposed to IL2/IL15-NKs or IFNα-NKs using a transwell co-culture system. Infection rates were calculated by measuring HCV-Ag levels released in the culture media seven days after co-culture. Each dot represents the average of three technical replicates from one donor (n = 10). Mean values ± SEM are shown. (D) Infection rates (percentage of control) of freshly plated Huh7.5 cells following exposure to medium conditioned with HCV-Huh7.5 cells that were co-cultured for seven days with IL2/IL15-NKs (gray bar) or IFNα-NKs (lilac bar). Each dot represents the average of three technical replicates from one donor (n = 4). Mean values ± SEM are shown. (E) Representative immunofluorescence staining of HCV-Ag (green color) in HCV-Huh7.5 cells seven days after co-culture with IL2/IL15-NKs (middle image) or IFNα-NKs (right image). Untreated cells were used as controls (left image). DAPI (blue color) was used to stain the nuclei. Magnification of 200×. (F) Intensity of fluorescent HCV-Ag signal in cells as in (E), expressed as arbitrary units (AU), as quantified with ImageJ software. Each dot represents the average of three technical replicates from one donor (n = 5). Mean values ± SD are shown. Statistical analyses were performed using a two-way ANOVA with the Šídák multiple comparison test (A,B), unpaired Student’s t-test (C,D), and the one-way ANOVA with Tukey’s multiple comparisons test. * p < 0.05, ** p < 0.01, **** p < 0.0001; n.s., non-significant.


