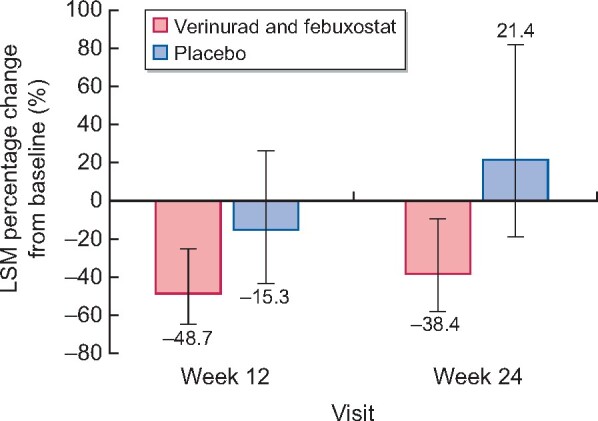
FIGURE 3.

LSM percentage change from baseline in UACR at Weeks 12 and 24 in the CITRINE study. Error bars are 95% CIs. Results are based on a mixed-effects model for repeated measures. Baseline mean (SD) UACR was 459.1 (824.7) mg/g for verinurad plus febuxostat and 411.6 (547.8) mg/g for placebo. LSM, least-squares mean.
