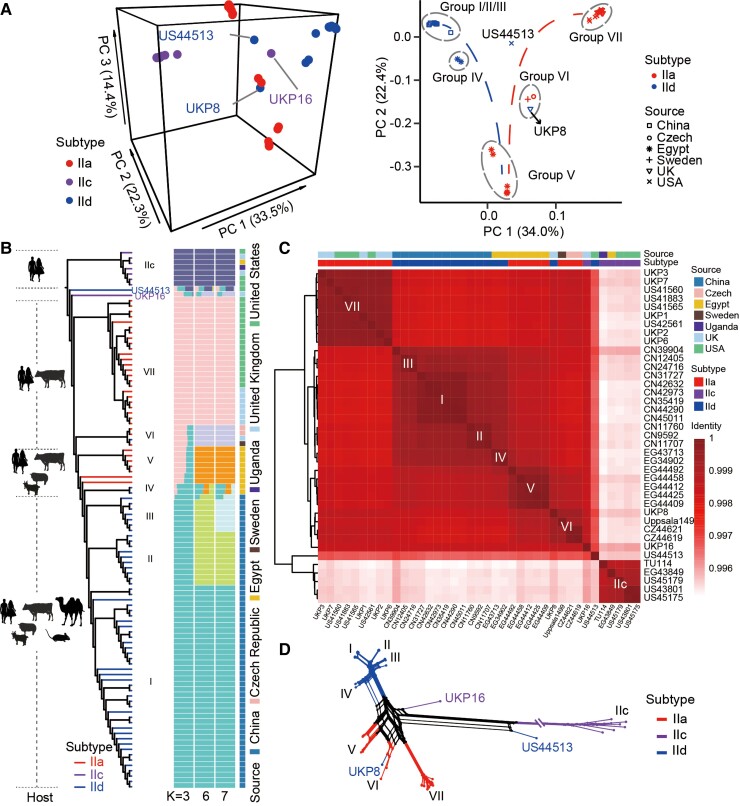
Fig. 2.
Population structure of C. parvum. (A) Results of PCA of genomes from all (left) and zoonotic (right) subtype families. The colors and symbols correspond to subtype families and sample sources. Groups are circled with gray dashed lines and marked with I–VII according to the results in (B). (B) Phylogeny and population structure of representative C. parvum isolates with K = 3, 6, and 7. The ML tree was built with 37,301 SNPs and rooted with the IIc clade. Major hosts of the clades are marked at the left panel and the clades are colored by subtype family. Subpopulations are marked with I–VII plus IIc. Each isolate is represented by a single bar in 3, 6, and 7 colored ancestral components depending on the K values used. All results with K values from 3 to 9 can be viewed in supplementary figure S4, Supplementary Material online. The mosaic color bars at the right represent the geographic origins of isolates. (C) Pairwise comparisons of ANI of selected C. parvum genomes. The identity blocks in dark red correspond to phylogenetic clusters in (B). Bars above the heatmap represent the geographic origin and subtype identity of selected genomes. (D) Phylogenetic network of C. parvum genomes based on 20,126 SNPs (with singletons removed). Branches are colored by gp60 subtype as in (B).

