Fig. 3.
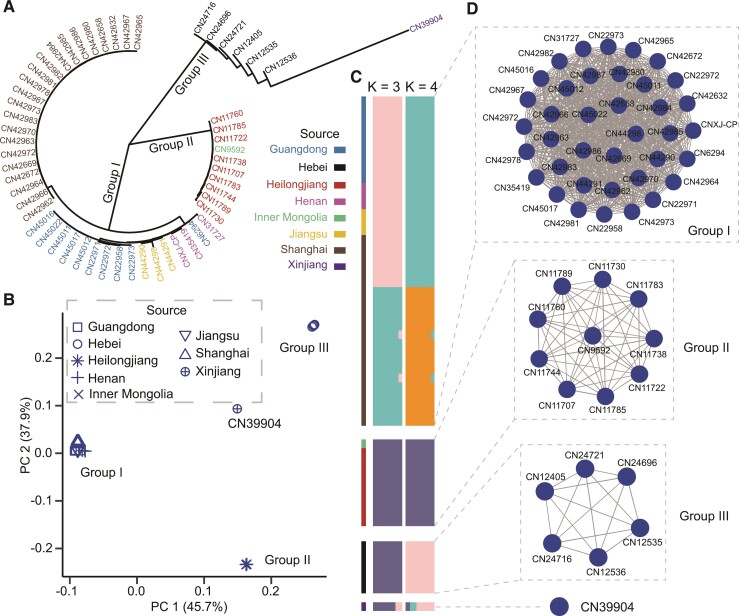
Homogenous subpopulation structure of C. parvum in China. (A) NJ tree of 2,953 concatenated SNPs. The color of isolates corresponds to their geographical origins. (B) Outcome of PCA of C. parvum in China. The shape of each node corresponds to the geographical origin of the isolate. (C) Population structure of C. parvum isolates in China. Each isolate is represented by a single bar in colored ancestral components at K = 3 and K = 4. The mosaic color bars at the top represent the geographic origins of the isolates. (D) Relatedness network for pairs of isolates in China with high proportion of IBD sharing. All 55 genomes constructed 3 big clusters with 763 edges and 1 orphan node (CN39904). The edge between two nodes is drawn if the IBD sharing fraction is over 90% of the genome, indicating highly genetic homology.

