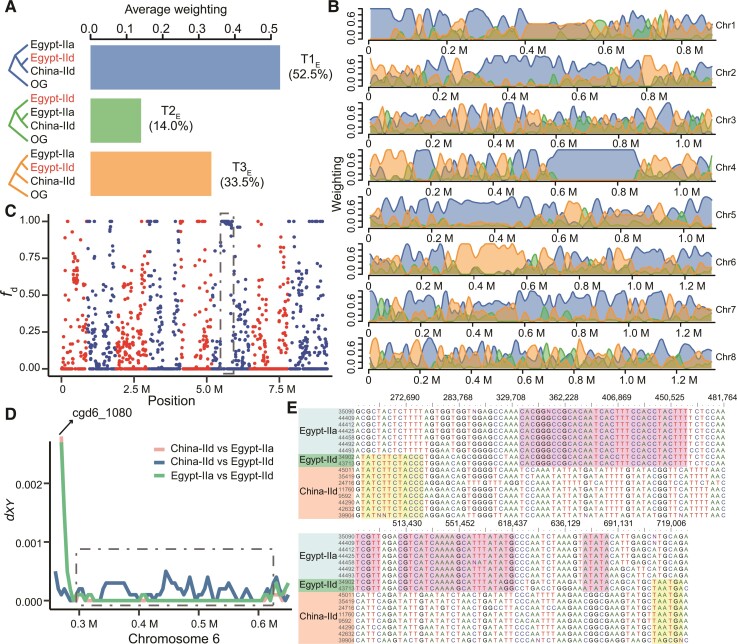
Fig. 4.
Sequence introgression in IId isolates of C. parvum from Egypt. (A) Average topology weighting among three subpopulations of C. parvum with Cryptosporidium hominis as the outgroup (OG). T1E accounts for the largest proportion, followed by T3E and T2E. (B) Topology weighting with a 10 kb sliding window along the eight chromosomes in the C. parvum genome. The proportion of each topology along the genome is shaded with colors corresponding to the three topologies in (A). (C) fd statistics of IIa and IId subtype families of C. parvum in Egypt. A 20 kb sliding window with 5 kb steps was used. Values closer to 1 are indicative of introgression between Egypt-IIa and Egypt-IId. The eight chromosomes are colored with alternative red and blue colors. The dashed box marks an introgression region (325k–600k) in which all isolates in Egypt share high ancestral similarity. (D) Sequence divergence among the three C. parvum subpopulations (Egypt-IIa, Egypt-IId, and China-IId) in one region of chromosome 6. In the gp60 (cgd6_1080) region, isolates in Egypt-IId have high sequence identity to China-IId. After it, IIa and IId in Egypt have high sequence identity in the region (0.3–0.6 M) marked with the dashed box corresponding to the box in (C). (E) Alignment of concatenated SNPs in the region marked in (C) and (D).

