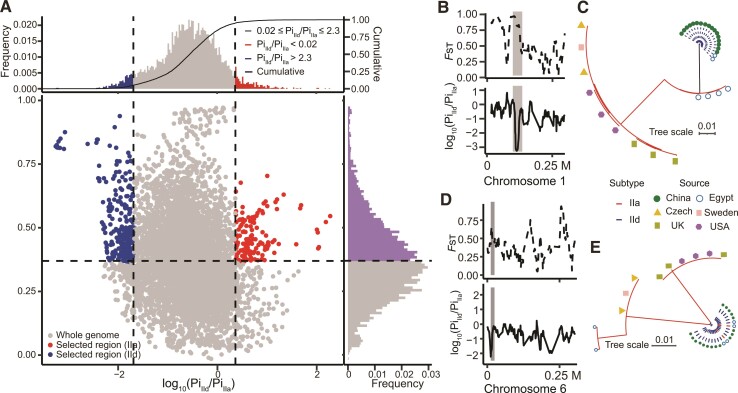
Fig. 7.
Selective sweep in zoonotic C. parvum. (A) Distribution of Pi ratios (IId/IIa) and Fst values calculated in a 10 kb sliding window with 1 kb steps, with the Pi ratio values being logarithmically transformed. Points located to the left (IId genomes) and right tails (IIa genomes) of the empirical Pi ratio distribution (left and right dash lines, respectively) and above the mean Fst value (horizontal dashed line) are considered selected regions. Two examples of regions with strong selective sweep signals in chromosomes 1 (B and C) and 6 (D and E) of the IId genomes are shown. The ML trees were built with SNPs located in selected regions (shaded area) using representative isolates in each group, with the source of the isolates being indicated.

