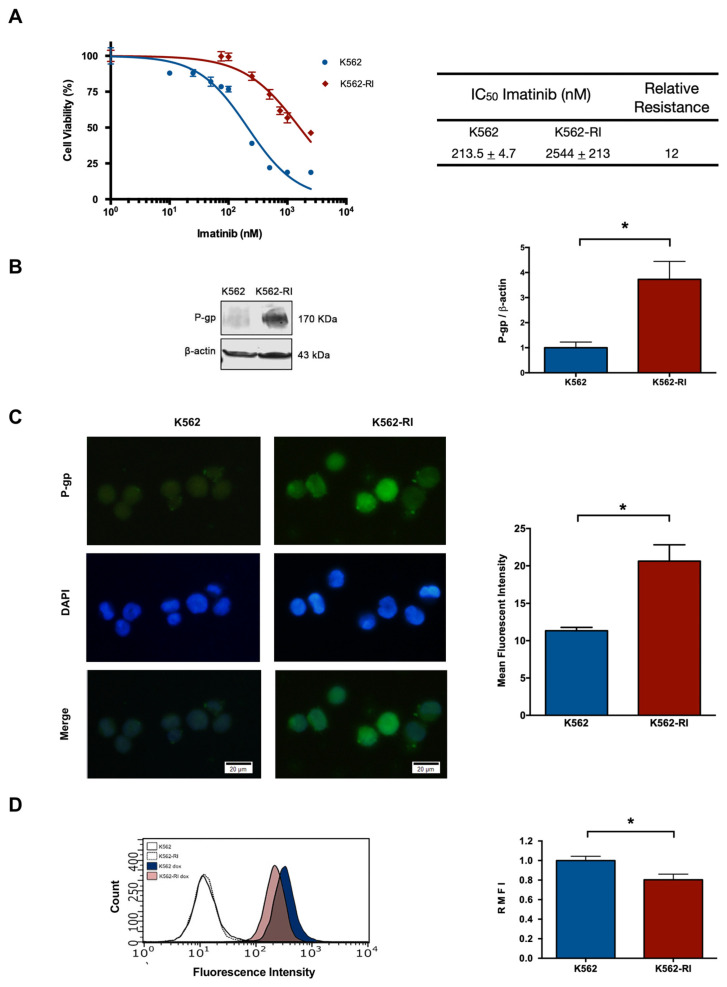
Figure 1.
The development of a CML cell line with resistance to imatinib treatment. (A) Percentage of cell viability after applying imatinib alone (at distinct concentrations), considering CML cells sensitive (K562) and resistant (K562-RI) to this drug. The table denotes the IC50 of imatinib in each cell line and the relative resistance of K562-RI (calculated as the IC50 of K562-RI divided by that of K562). (B) P-gp expression levels in the K562 and K562-RI cell lines, based on Western blot and its densitometric analysis (β-actin was the load control); three Western blots from three independent experiments were used for densitometric analysis. (C) Analysis of P-gp evaluated by the immunofluorescence assay (the nuclei were visualized with DAPI). The mean fluorescence intensity was quantified by counting P-gp-positive cells from three independent experiment. Scale bars: 20 μm. (D) Representative histograms of the fluorescence of uptake of doxorubicin in the K562 and K562-RI cell lines. The empty histograms depict the control cells without doxorubicin. Data are expressed as the relative mean fluorescence intensity (RMFI) ± SEM of three independent experiments. The values of k562-RI were normalized with respect to K562. Statistical analysis was performed by comparing K562-RI to the parental cell line. * p < 0.05; Student’s t-test.

