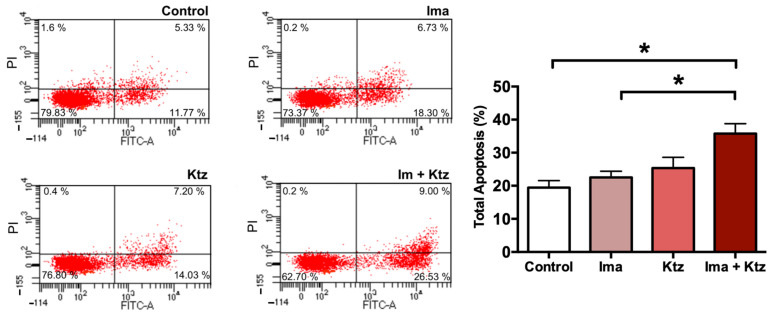
Figure 5.
Flow cytometric analysis of apoptosis in K562-RI cells at 96 h post-treatment. Representative histograms depicting cells positive to Annexin V-FITC/IP (early and late apoptosis) by flow cytometric analysis; and percentage of total apoptosis. * p < 0.05, examined with one-way analysis of variance (ANOVA) followed by Tukey’s test. Data are expressed as the mean ± SEM of three independent experiments. Ima, imatinib (200 nM); Ktz, ketoconazole (10 μM); Ima + Ktz, the combination of imatinib plus ketoconazole (200 nM/10 μM).

