
Fig. 1.
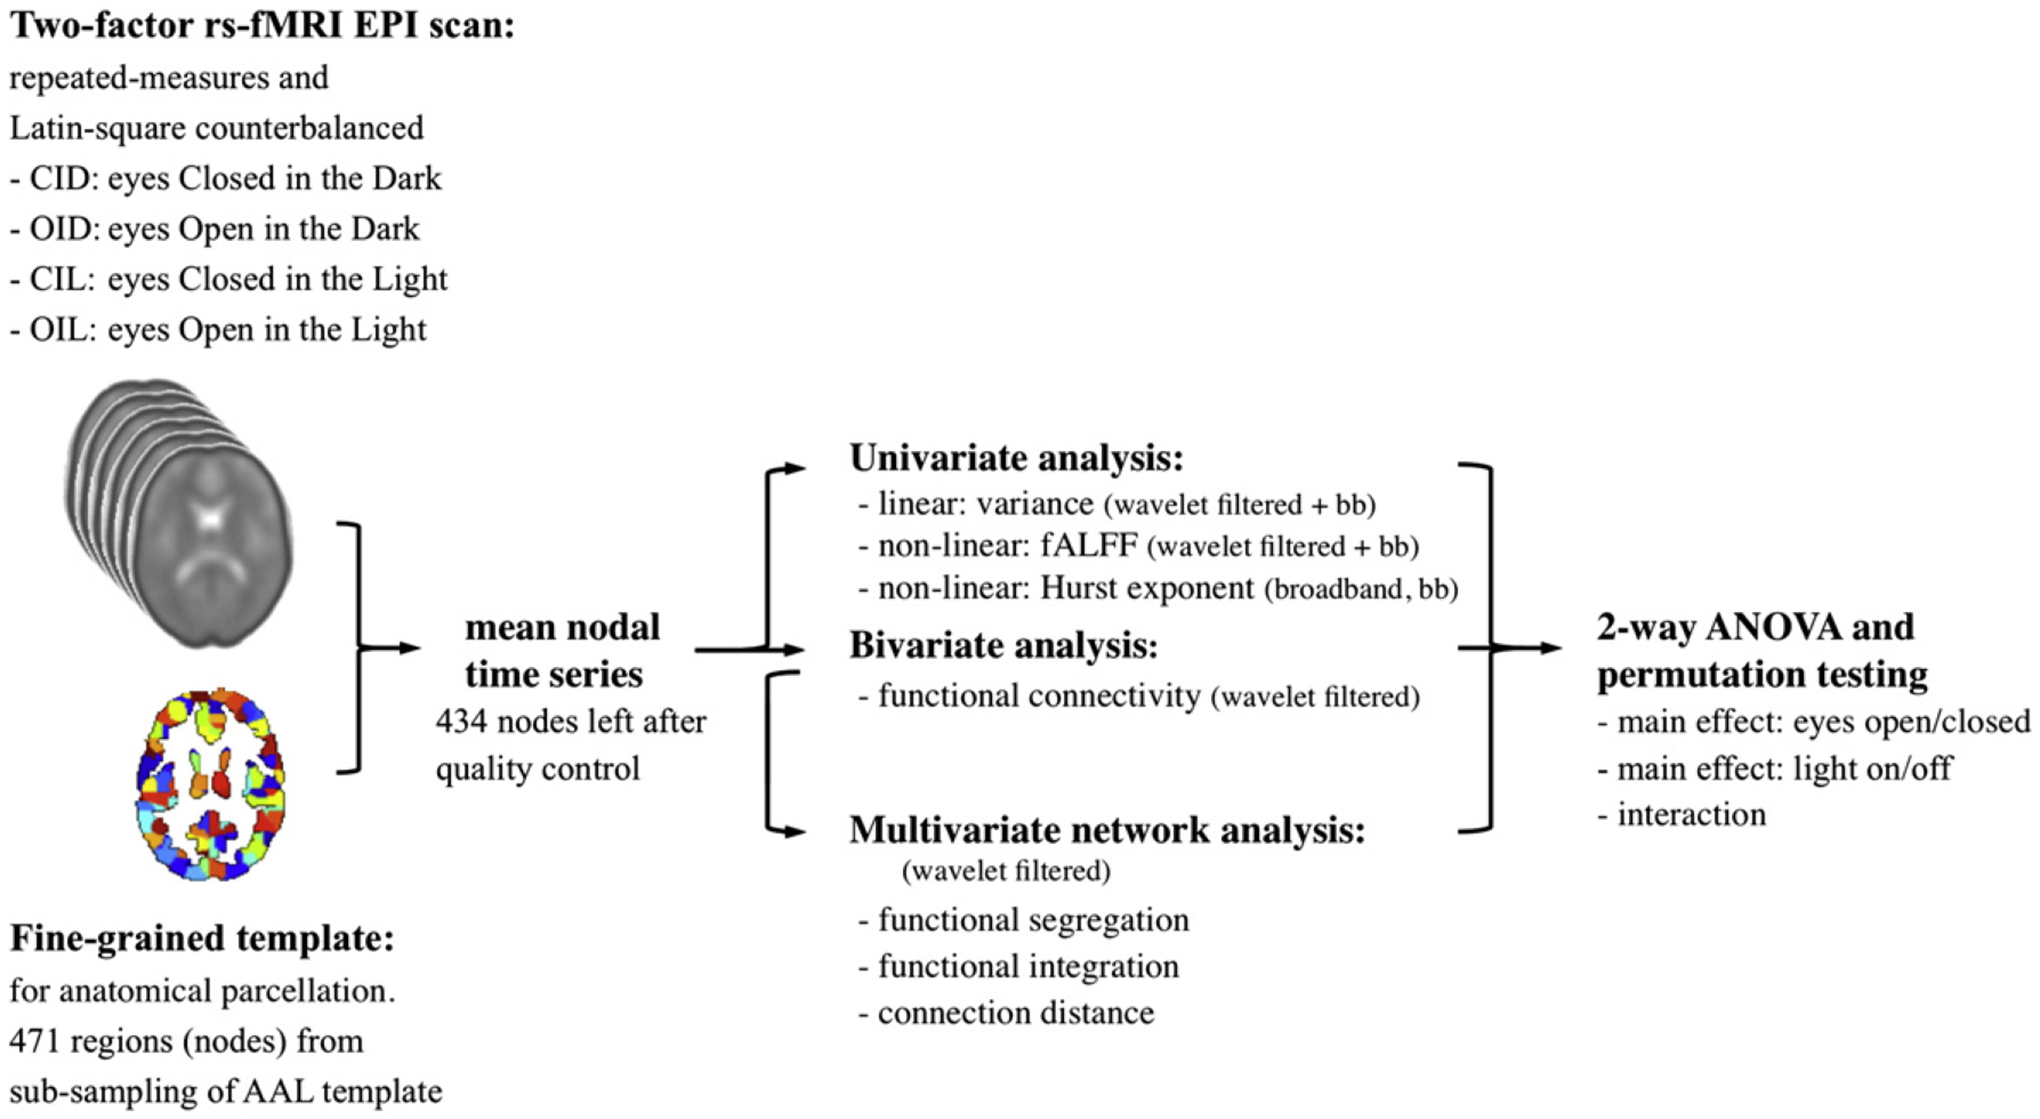
Schematic of the fMRI analysis pipeline. EPI data were preprocessed, coregistered into standard MNI space, and parcellated anatomically using a template image derived by sub-sampling the regions defined by the automated anatomical labeling (AAL) template. Each nodal time series was then analyzed with univariate, bivariate, and multivariate approaches by using the broadband time series before wavelet transformation and/or the wavelet filtered data. Between-condition differences were assessed by permutation testing controlled for repeated measures on within-subject factors.