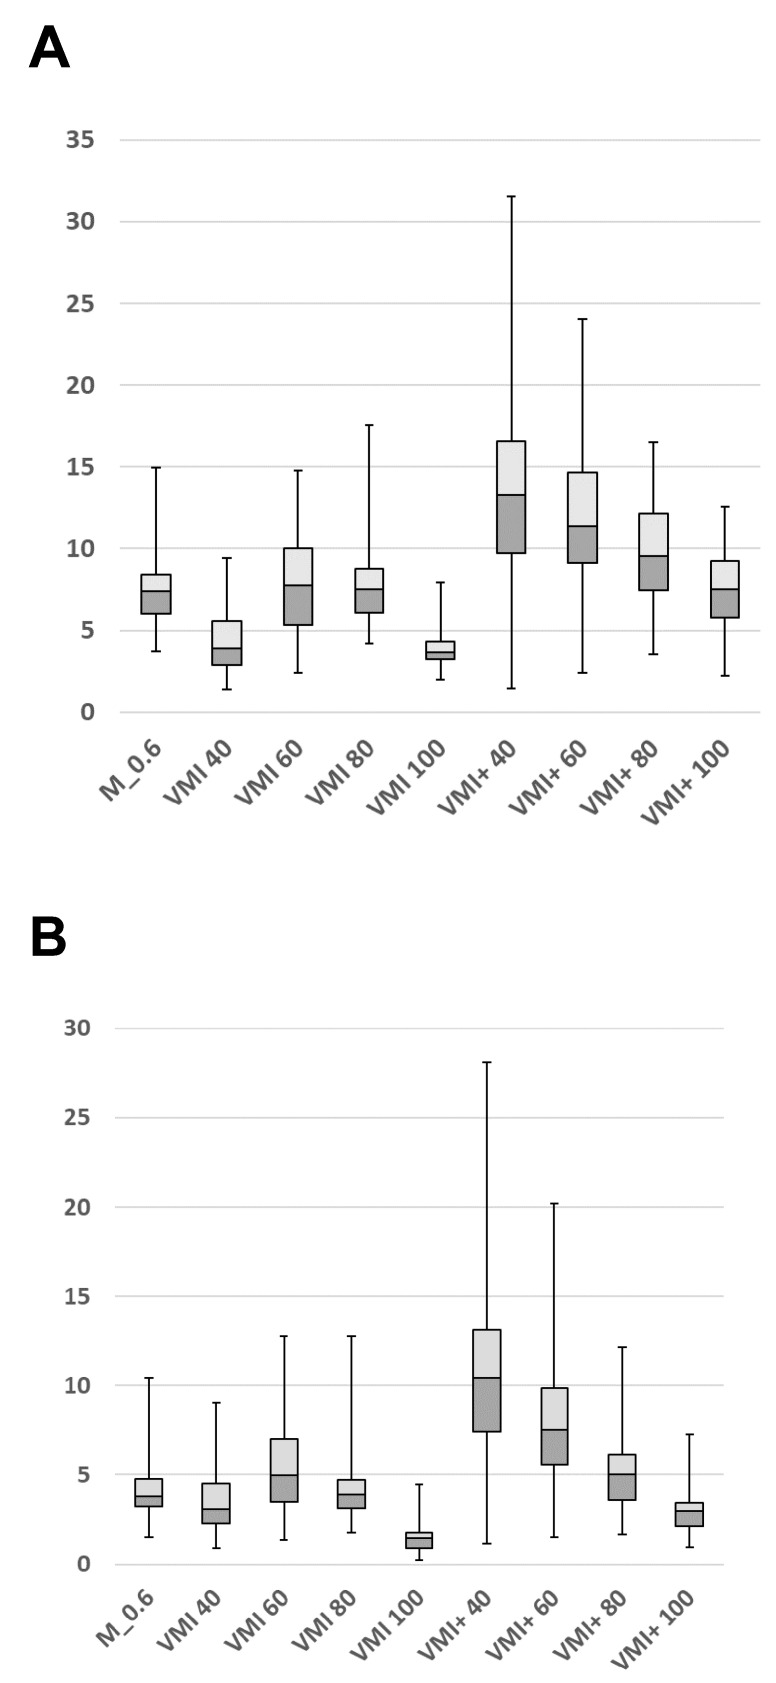
Figure 2.
The box-and-whisker plots demonstrate the results of the quantitative image analysis (variables are presented as means ± SD). Signal-to-noise (SNR, A) and contrast-to-noise ratios (CNR, B) in the portal vein were compared between linearly blended M_0.6, standard virtual monoenergetic imaging (VMI), and noise-optimized VMI+ series at different keV levels.

