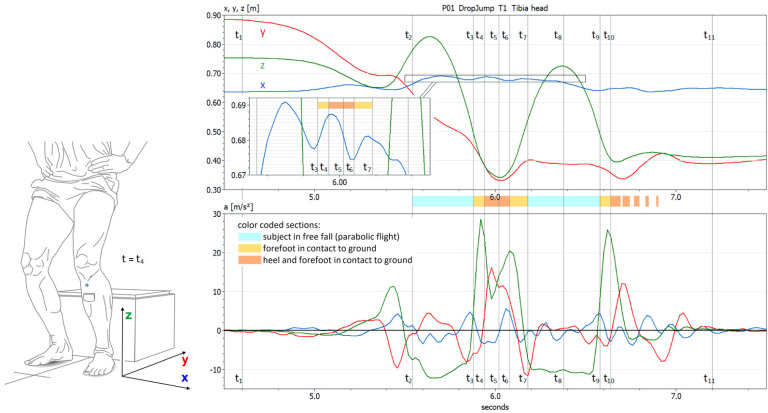
Figure 4.
Test 7 Drop Jump. Focus of the measurement: the mediolateral movement of the tibia head (blue curves). Upper diagram: 3D coordinates (x, y, z) of the tibia head marker measured by the video-MA. Lower diagram: acceleration (ax, ay, az) of the tibia head marker determined by double derivation of the coordinates. Events ti are characteristic moments of the motion pattern such as forefoot or heel touch down. In the example shown, the tibia head shifts during landing between t4 and t6 (the foot lies flat on the ground) by 13 mm towards the medial.

