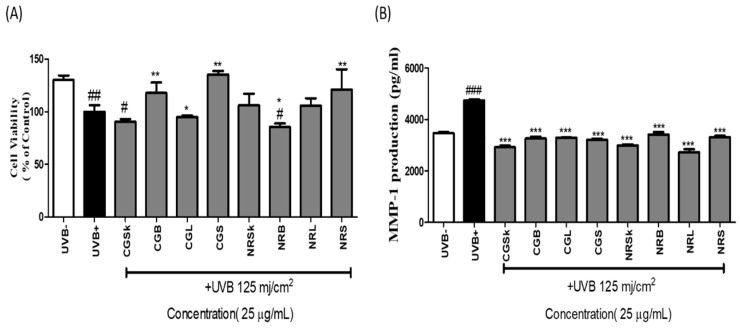
Figure 3.
(A) Cell viability and (B) inhibitory activity upon UVB-induced MMP-1 production of extracts of different organs of C. gunnari (CG) and N. rossii (NR). SK = skin, B = brain, L = liver, S = stomach. Each value is represented as the mean ± SEM of triplicate experiments. (*) p < 0.05, (**) p < 0.01, and (***) p < 0.001 compared to UVB treatment group; (#) p < 0.05, (##) p < 0.01, and (###) p < 0.001 compared to normal control group.

